

Question: Figure 7.15 shows a density function and the corresponding cumulative distribution function. (a) Which curve represents the density function and which represents the cumulative distribution
Figure 7.15 shows a density function and the corresponding cumulative distribution function.
(a) Which curve represents the density function and which represents the cumulative distribution function? Give a reason for your choice.
(b) Put reasonable values on the tick marks on each of the axes.
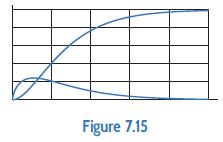
Figure 7.15
Step by Step Solution
★★★★★
3.59 Rating (156 Votes )
There are 3 Steps involved in it
1 Expert Approved Answer
Step: 1 Unlock

a The two functions are shown below The choice is based on the fact that the cumulative di... View full answer
Question Has Been Solved by an Expert!
Get step-by-step solutions from verified subject matter experts
Step: 2 Unlock
Step: 3 Unlock