

Figure 8.16 on page 348 gives a contour diagram of corn production as a function of rainfall,
Question:
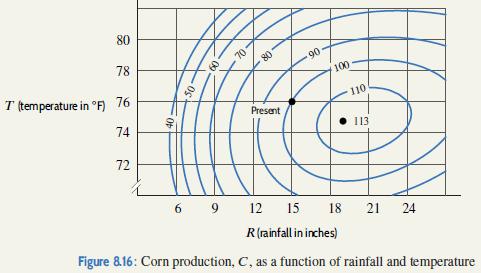
Figure 8.16 on page 348 gives a contour diagram of corn production as a function of rainfall, R, in inches and temperature, T , in ◦F. Corn production, C, is measured as a percentage of the present production, and C = f(R, T). Estimate the following quantities. Give units and interpret your answers in terms of corn production:
(a) fR(15, 76)
(b) fT (15, 76)
Figure 8.16
Fantastic news! We've Found the answer you've been seeking!
Step by Step Answer:
a We know that we can approximate f R at a point R T by ...View the full answer

Answered By
Joemar Canciller
I teach mathematics to students because I love to share what I have in this field.
I also want to see the students to love math and be fearless in this field.
I've been tutoring these past 2 years and I would like to continue what I've been doing.
1+ Reviews
10+ Question Solved
Related Book For 

Applied Calculus
ISBN: 9781119275565
6th Edition
Authors: Deborah Hughes Hallett, Patti Frazer Lock, Andrew M. Gleason, Daniel E. Flath, Sheldon P. Gordon, David O. Lomen, David Lovelock, William G. McCallum, Brad G. Osgood, Andrew Pasquale
Question Posted:
