

The supply and demand curves for a product are given in Figure 6.40. Estimate the equilibrium price
Question:
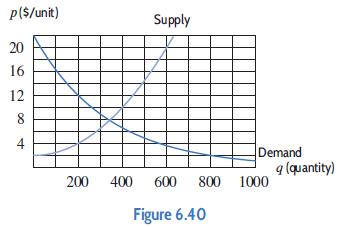
The supply and demand curves for a product are given in Figure 6.40. Estimate the equilibrium price and quantity and the consumer and producer surplus. Shade areas representing the consumer surplus and the producer surplus.
Fantastic news! We've Found the answer you've been seeking!
Step by Step Answer:
Looking at the graph we see that the supply and demand ...View the full answer

Answered By
Cristine kanyaa
I possess exceptional research and essay writing skills. I have successfully completed over 5000 projects and the responses are positively overwhelming . I have experience in handling Coursework, Session Long Papers, Manuscripts, Term papers, & Presentations among others. I have access to both physical and online library. this makes me a suitable candidate to tutor clients as I have adequate materials to carry out intensive research.
1538+ Reviews
3254+ Question Solved
Related Book For 

Applied Calculus
ISBN: 9781119275565
6th Edition
Authors: Deborah Hughes Hallett, Patti Frazer Lock, Andrew M. Gleason, Daniel E. Flath, Sheldon P. Gordon, David O. Lomen, David Lovelock, William G. McCallum, Brad G. Osgood, Andrew Pasquale
Question Posted:
