

Consider an EMWA control chart. The target value for the process is μ 0 = 50 and
Question:
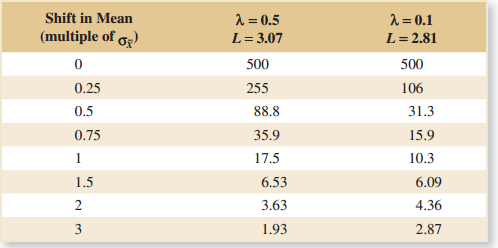
(a) If the sample size is n = 1, would you prefer an EWMA chart with λ = 0.1 and L = 2.81 or λ = 0.5 and L = 3.07 to detect a shift in the process mean to μ = 52 on average? Why?
(b) If the sample size is increased to n = 4, which chart in part (a) do you prefer? Why?
(c) If an EWMA chart with λ = 0.1 and L = 2.81 is used, what sample size is needed to detect a shift to μ = 52 in approximately three samples on average?
Table 15-11
Fantastic news! We've Found the answer you've been seeking!
Step by Step Answer:
a The shift of the mean is 1 So we prefer 001 and L281 beca...View the full answer

Answered By
Fahmin Arakkal
Tutoring and Contributing expert question and answers to teachers and students.
Primarily oversees the Heat and Mass Transfer contents presented on websites and blogs.
Responsible for Creating, Editing, Updating all contents related Chemical Engineering in
latex language
8+ Reviews
22+ Question Solved
Related Book For 

Applied Statistics And Probability For Engineers
ISBN: 9781118539712
6th Edition
Authors: Douglas C. Montgomery, George C. Runger
Question Posted:
