

Question: Consider the concentration data in Exercise 15-76. Use = 8 and assume that the desired process target is 100. (a) Construct an EWMA control
Consider the concentration data in Exercise 15-76. Use σ = 8 and assume that the desired process target is 100.
(a) Construct an EWMA control chart with λ = 0.2. Does the process appear to be in control?
(b) Construct an EWMA control chart with λ = 0.5. Compare your results to part (a).
(c) If the concentration shifted to 104, would you prefer the chart in part (a) or (b)? Explain.
Exercise 15-76
The concentration of a chemical product is measured by taking four samples from each batch of material. The average concentration of these measurements for the last 20 batches is shown in the following table:
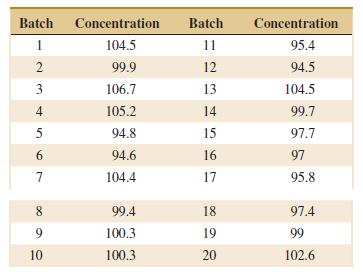
Concentration Batch Concentration Batch 1 104.5 11 95.4 99.9 12 94.5 106.7 3 13 104.5 4 105.2 14 99.7 97.7 94.8 15 94.6 6. 16 97 104.4 17 95.8
Step by Step Solution
3.49 Rating (146 Votes )
There are 3 Steps involved in it
a The process appears to be in control b The process appear... View full answer

Get step-by-step solutions from verified subject matter experts