

Question: Consider the regression model fit to the nisin extraction data in Exercise 12-18. (a) What proportion of total variability is explained by this model? (b)
Consider the regression model fit to the nisin extraction data in Exercise 12-18.
(a) What proportion of total variability is explained by this model?
(b) Construct a normal probability plot of the residuals. What conclusion can you draw from this plot?
(c) Plot the residuals versus y and versus each regressor, and comment on model adequacy.
(d) Calculate Cook€™s distance for the observations in this data set. Are there any influential points in these data?
Exercise 12-18
An article in Biotechnology Progress (2001, Vol. 17, pp. 366€“368) reported on an experiment to investigate and optimize nisin extraction in aqueous two-phase systems (ATPS). The nisin recovery was the dependent variable (y). The two regressor variables were concentration (%) of PEG 4000 (denoted as x1 and concentration (%) of Na2SO4 (denoted as x2). The data are in Table E12-10.
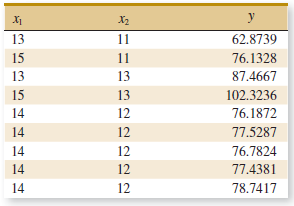
y X1 X2 62.8739 13 11 11 15 76.1328 13 13 87.4667 15 13 102.3236 76.1872 14 12 77.5287 14 12 14 12 76.7824 14 12 77.4381 12 14 78.7417
Step by Step Solution
3.34 Rating (187 Votes )
There are 3 Steps involved in it
a R 2 937 b The normal assumption appears inadequate c The constant ... View full answer

Get step-by-step solutions from verified subject matter experts