

Question: Consider the stack loss data in Exercise 12-20. (a) What proportion of total variability is explained by this model? (b) Construct a normal probability plot
(a) What proportion of total variability is explained by this model?
(b) Construct a normal probability plot of the residuals. What conclusion can you draw from this plot?
(c) Plot the residuals versus ˆy and versus each regressor, and comment on model adequacy.
(d) Calculate Cook€™s distance for the observations in this data set. Are there any influential points in these data?
Exercise 12-20
An article in Technometrics (1974, Vol. 16, pp. 523€“531) considered the following stack-loss data from a plant oxidizing ammonia to nitric acid. Twenty-one daily responses of stack loss (the amount of ammonia escaping) were measured with air flow x1, temperature x2, and acid concentration x3.
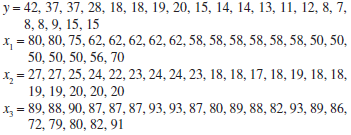
y = 42, 37, 37, 28, 18, 18, 19, 20, 15, 14, 14, 13, 11, 12, 8, 7, 8, 8, 9, 15, 15 x, = 80, 80, 75, 62, 62, 62, 62, 62, 58, 58, 58, 58, 58, 58, 50, 50, 50, 50, 50, 56, 70 x, = 27, 27, 25, 24, 22, 23, 24, 24, 23, 18, 18, 17, 18, 19, 18, 18, 19, 19, 20, 20, 20 x, = 89, 88, 90, 87, 87, 87, 93, 93, 87, 80, 89, 88, 82, 93, 89, 86, 72, 79, 80, 82, 91
Step by Step Solution
3.49 Rating (159 Votes )
There are 3 Steps involved in it
a R 2 914 b Assumption of normality appears adequate c Assumption ... View full answer

Get step-by-step solutions from verified subject matter experts