

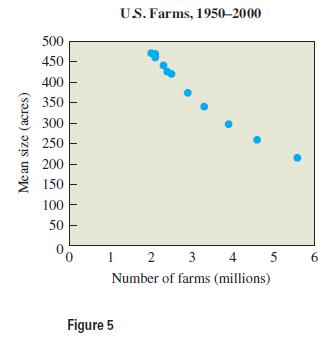
Figure 5 shows a scatterplot for the variables number of farms and mean farm size in the
Question:
Figure 5 shows a scatterplot for the variables number of farms and mean farm size in the United States. Each dot represents data from a single year between 1950 and 2000; on this diagram, the earlier years generally are on the right and the later years on the left. Estimate the correlation coefficient by comparing this diagram to those in Figure 3 and discuss the underlying reasons for the correlation.
Fantastic news! We've Found the answer you've been seeking!
Step by Step Answer:
The scatterplot shows a strong negative correlation th...View the full answer

Answered By
Akash Goel
I am in the teaching field since 2008 when i was enrolled myself in chartered accountants course
Since then i have an experience of teaching of class XI, XII, BCOM, MCOM, MBA, CA CPT.
1+ Reviews
10+ Question Solved
Related Book For 
Statistical Reasoning For Everyday Life
ISBN: 9780321904645
4th International Edition
Authors: Jeffrey Bennett, William L. Briggs, Mario F. Triola
Question Posted:
