

Question: Graph the function if the given changes are made in the indicated examples of this section. In Example 2, if the sign of the coefficient
Graph the function if the given changes are made in the indicated examples of this section.
In Example 2, if the sign of the coefficient of cos x is changed, plot the graph of the resulting function.
Data from Example 2
Plot the graph of y = −3 cos x.
In this case, a = −3, and this means that the amplitude is −3 = 3. Therefore, the maximum value of y is 3, and the minimum value of y is −3. The table of values follows, and the curve is shown in Fig. 10.6.

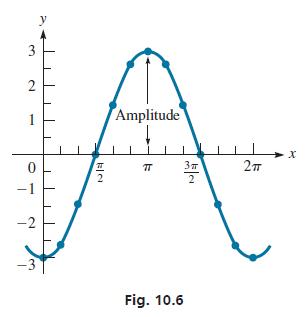
X y X 0 6 -3 -2.6 -1.5 0 1.5 2.6 3 11 6 3 y 2.6 1.5 2 3 5 27 1.5 0 -1.5 -2.6 -3
Step by Step Solution
3.42 Rating (168 Votes )
There are 3 Steps involved in it
If we change the sign of the coefficient of cosx then th... View full answer

Get step-by-step solutions from verified subject matter experts