

Question: Graph the function if the given changes are made in the indicated examples of this section. In Example 4, if the sign of the coefficient
Graph the function if the given changes are made in the indicated examples of this section.
In Example 4, if the sign of the coefficient of sin x is changed, display the graph of the resulting function.
Data from Example 4
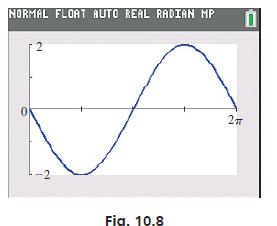
A certain water wave can be represented by the equation y = −2 sin x (measurements in ft). Display the graph on a calculator. Using radian mode on the calculator, Fig. 10.8 shows the calculator view for the key values in the following table:
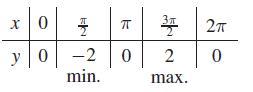
We see the amplitude of 2 and the effect of the negative sign in inverting the curve.
T 0 X y 0 -2 min. 0 3T 2 max. 2T 0
Step by Step Solution
3.45 Rating (168 Votes )
There are 3 Steps involved in it
We are changing the sign of the coefficient of sinxit becomes then y ... View full answer

Get step-by-step solutions from verified subject matter experts