

Question: Graph the function if the given changes are made in the indicated examples of this section. In Example 2, if the coefficient of x is
Graph the function if the given changes are made in the indicated examples of this section.
In Example 2, if the coefficient of x is changed from 4 to 6, graph one complete cycle of the resulting function.
Data from Example 2
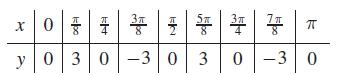
Sketch the graph of y = 3sin 4x for 0 ≤ x ≤ π. Because a = 3, the amplitude is 3. The 4x tells us that the period is 2π/4 = π/2. This means that y = 0 for x = 0 and for y = π/2. Because this sine function is zero halfway between x = 0 and x = π/2, we find that y = 0 for x = π/4. Also, the fact that the graph of the sine function reaches its maximum and minimum values halfway between zeros means that y = 3 for x = π/8, and y = −3 for x = 3π/8. Note that the values of x in the following table are those for which 4x = 0, π/2, π, 3π/2, 2π, and so on.
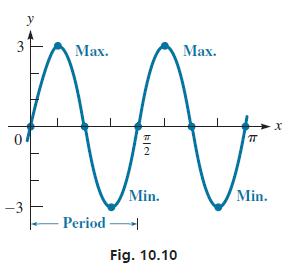
Using the values from the table and the fact that the curve is sinusoidal in form, we sketch the graph of this function in Fig. 10.10. We see again that knowing the key values and the basic shape of the curve allows us to sketch the graph of the curve quickly and easily.
x0 0 | y + 3 Sm 0-3 0 0 3 0 3 0 3 3 0
Step by Step Solution
3.35 Rating (167 Votes )
There are 3 Steps involved in it
If we change the coefficient of x from 4 to 6 then t... View full answer

Get step-by-step solutions from verified subject matter experts