

Question: Graph the function if the given changes are made in the indicated examples of this section. In Example 3, if the coefficient of x is
Graph the function if the given changes are made in the indicated examples of this section.
In Example 3, if the coefficient of x is changed from 3 to 4, sketch the graph of the resulting function.
Data from Example 3
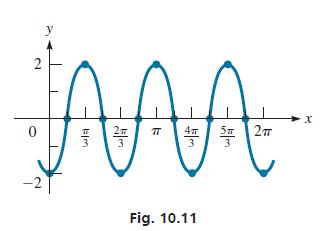
Sketch the graph of y = −2 cos 3x for 0 ≤ x ≤ 2π.
Note that the amplitude is 2 and the period is 2π/3. This means that one-fourth of the period is
![]()
Because the cosine curve is at a maximum or minimum for x = 0,
we find that y = −2 for x = 0 (the negative value is due to the minus sign before the
function), which means it is a minimum point. The curve then has a zero at x =π/6, a maximum value of 2 at
![]()
and its next value of![]()
and so on. Therefore, we have the following table:
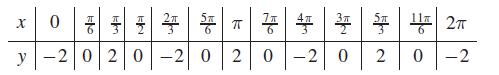
Using this table and the sinusoidal shape of the cosine curve, we sketch the function in Fig. 10.11.
9 = x + X
Step by Step Solution
3.45 Rating (177 Votes )
There are 3 Steps involved in it
Note that the amplitude is 2 and the period is 23 This mean... View full answer

Get step-by-step solutions from verified subject matter experts