

Question: In a particular electric circuit, called a low-pass filter, the input voltage V i is across a resistor and a capacitor, and the output voltage
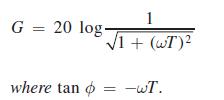
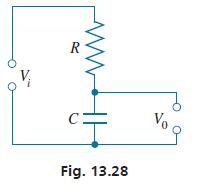
In a particular electric circuit, called a low-pass filter, the input voltage Vi is across a resistor and a capacitor, and the output voltage V0 is across the capacitor (see Fig. 13.28). The voltage gain G (in dB) is given by
Here, ∅ is the phase angle of V0/Vi. For values of ωT of 0.01, 0.1, 0.3, 1.0, 3.0, 10.0, 30.0, and 100, plot the indicated graphs. These graphs are called a Bode diagram for the circuit.
Calculate values of ∅ (as negative angles) for the given values of ωT and plot a semilogarithmic graph of ∅ vs. ωT
1 G = 20 log1+ (wT) where tan -WT.
Step by Step Solution
3.38 Rating (151 Votes )
There are 3 Steps involved in it
To plot the Bode diagram for the lowpass filter circuit we need to evaluate the voltage gain G in dB ... View full answer

Get step-by-step solutions from verified subject matter experts