

Question: Make the given changes in the indicated examples of this section and then plot the graphs. In Example 2, change 2x 2 4 to
Make the given changes in the indicated examples of this section and then plot the graphs.
In Example 2, change 2x2 − 4 to 4 − 2x2.
Data from Example 2
Graph the function f (x) = 2x2 − 4.
First, let y = 2x2 − 4 and tabulate the values as shown in Fig. 3.16. In determining the values in the table, take particular care to obtain the correct values of y for negative values of x. Mistakes are relatively common when dealing with negative numbers. We must carefully use the laws for signed numbers. For example, if x = −2, we have y = 2(−2) 2 − 4 = 2(4) − 4 = 8 − 4 = 4. Once the values are obtained, plot and connect the points with a smooth curve, as shown.
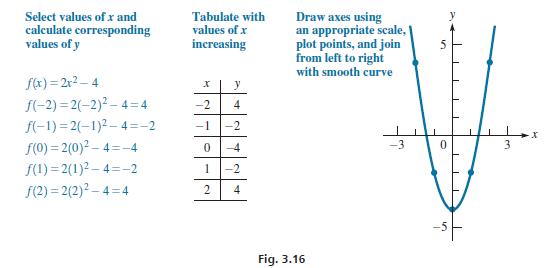
Select values of x and calculate corresponding values of y f(x)=2x-4 f(-2)=2(-2)-4-4 f(-1)=2(-1)2-4=-2 f(0) = 2(0)-4--4 f(1) 2(1)2-4--2 f(2)=2(2)-4=4 Tabulate with values of x increasing y 4 -2 -1 -2 0 -4 1 -2 2 4 Draw axes using an appropriate scale, plot points, and join from left to right with smooth curve Fig. 3.16 10 0 5 3 X
Step by Step Solution
3.43 Rating (153 Votes )
There are 3 Steps involved in it
We are given fx 4 2x 2 We need to plot this graph The ... View full answer

Get step-by-step solutions from verified subject matter experts