

Question: Make the given changes in the indicated examples of this section and then plot the graphs. In Example 5, change the + sign to .
Make the given changes in the indicated examples of this section and then plot the graphs.
In Example 5, change the + sign to −.
Data from Example 5
Graph the function
![]()
When finding the points for the graph, we may not let x take on any value less than −1, for all such values would lead to imaginary values for y and are not in the domain. Also, because we have the positive square root indicated, the range consists of all values of y that are positive or zero (y ≥ 0). See Fig. 3.19. Note that the graph starts at (−1, 0).
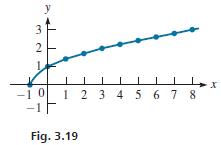
y = x + 1.
Step by Step Solution
★★★★★
3.40 Rating (162 Votes )
There are 3 Steps involved in it
1 Expert Approved Answer
Step: 1 Unlock

Question Has Been Solved by an Expert!
Get step-by-step solutions from verified subject matter experts
Step: 2 Unlock
Step: 3 Unlock