

Make the given changes in the indicated examples of this section and then solve the resulting problems.
Question:
Make the given changes in the indicated examples of this section and then solve the resulting problems.
In Example 3, change the − sign before 8x to + and then sketch the graph.
Data from Example 3
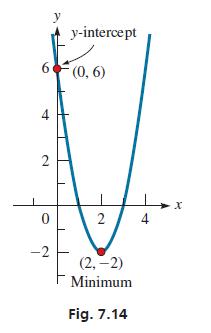
For the graph of the function y = 2x2 − 8x + 6, find the vertex and y-intercept and sketch the graph. (This function was also used in Example 2.) First, a = 2 and b = −8. This means that the x-coordinate of the vertex is
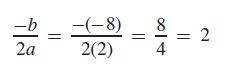
and the y-coordinate is y = 2(22) − 8(2) + 6 = −2
Thus, the vertex is (2, −2). Because a > 0, it is a minimum point. Because c = 6, the y-intercept is (0, 6).
We can use the minimum point (2, −2) and the y-intercept (0, 6), along with the fact that the graph is a parabola, to get an approximate sketch of the graph. Noting that a parabola increases (or decreases) away from the vertex in the same way on each side of it (it is symmetric with respect to a vertical line through the vertex), we sketch the graph in Fig. 7.14. It is the same graph as that shown in Fig. 7.13(a).
Step by Step Answer:
We are given the equation y 2x 2 8x 6 after changing the sig...View the full answer


Basic Technical Mathematics
ISBN: 9780137529896
12th Edition
Authors: Allyn J. Washington, Richard Evans
