

Question: The data in the table show the global mean land-ocean temperature index (using a base period of 19511980) for various years. Make a time series
The data in the table show the global mean land-ocean temperature index (using a base period of 1951–1980) for various years. Make a time series graph of these data.
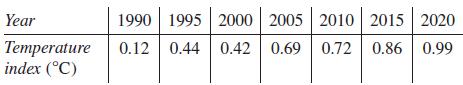
Year Temperature index (C) 1990 1995 0.12 0.44 2000 2005 0.42 0.69 0.69 2010 2015 2020 0.72 0.72 0.86 0.99
Step by Step Solution
★★★★★
3.39 Rating (158 Votes )
There are 3 Steps involved in it
1 Expert Approved Answer
Step: 1 Unlock

As we have the global mean landocean temperatur... View full answer
Question Has Been Solved by an Expert!
Get step-by-step solutions from verified subject matter experts
Step: 2 Unlock
Step: 3 Unlock