New Semester
Started
Get
50% OFF
Study Help!
--h --m --s
Claim Now
Question Answers
Textbooks
Find textbooks, questions and answers
Oops, something went wrong!
Change your search query and then try again
S
Books
FREE
Study Help
Expert Questions
Accounting
General Management
Mathematics
Finance
Organizational Behaviour
Law
Physics
Operating System
Management Leadership
Sociology
Programming
Marketing
Database
Computer Network
Economics
Textbooks Solutions
Accounting
Managerial Accounting
Management Leadership
Cost Accounting
Statistics
Business Law
Corporate Finance
Finance
Economics
Auditing
Tutors
Online Tutors
Find a Tutor
Hire a Tutor
Become a Tutor
AI Tutor
AI Study Planner
NEW
Sell Books
Search
Search
Sign In
Register
study help
business
biostatistics
Biostatistics For The Biological And Health Sciences 2nd Edition Marc Triola, Mario Triola, Jason Roy - Solutions
Vision Correction Here is a 95% confidence interval estimate of the proportion of adults who correct their vision by wearing contact lenses: 0.110 6 p 6 0.150 (based on data from a Vision Council survey). What is the best point estimate of the proportion of adults in the population who correct
Finite Population Correction Factor If a simple random sample of size n is selected without replacement from a finite population of size N, and the sample size is more than 5% of the population size 1n 7 0.05N2, better results can be obtained by using the finite population correction factor, which
Mean Body Temperature Data Set 2 “Body Temperatures” in Appendix B includes 106 body temperatures of adults for day 2 at 12 AM, and they vary from a low of 96.5 F to a high of 99.6 F. Find the minimum sample size required to estimate the mean body temperature of all adults. Assume that we want
Mean Pulse Rate of Males Data Set 1 “Body Data” in Appendix B includes pulse rates of 153 randomly selected adult males, and those pulse rates vary from a low of 40 bpm to a high of 104 bpm. Find the minimum sample size required to estimate the mean pulse rate of adult males. Assume that we
Mean Pulse Rate of Females Data Set 1 “Body Data” in Appendix B includes pulse rates of 147 randomly selected adult females, and those pulse rates vary from a low of 36 bpm to a high of 104 bpm. Find the minimum sample size required to estimate the mean pulse rate of adult females. Assume that
Mean Age of Female Medical Students Data Set 1 “Body Data” in Appendix B includes ages of 147 randomly selected adult females, and those ages have a standard deviation of 17.7 years. Assume that ages of female medical students have less variation than ages of females in the general population,
Mean Weight of Male Medical Students Data Set 1 “Body Data” in Appendix B includes weights of 153 randomly selected adult males, and those weights have a standard deviation of 17.65 kg. Because it is reasonable to assume that weights of male medical students have less variation than weights of
Mean Grade-Point Average Assume that all grade-point averages are to be standardized on a scale between 0 and 4.How many grade-point averages must be obtained so that the sample mean is within 0.01 of the population mean? Assume that a 95% confidence level is desired.If we use the range rule of
Mean IQ of Psychologists See the preceding exercise, in which we can assume that s = 15 for the IQ scores. Psychologists are a group with IQ scores that vary less than the IQ scores of the general population. Find the sample size needed to estimate the mean IQ of psychologists, given that we want
Mean IQ of Nurses The Wechsler IQ test is designed so that the mean is 100 and the standard deviation is 15 for the population of normal adults. Find the sample size necessary to estimate the mean IQ score of nurses. We want to be 99% confident that our sample mean is within 4 IQ points of the true
Nicotine in Cigarettes Refer to Data Set 15 “Cigarette Contents” in Appendix B and assume that the samples are simple random samples obtained from normally distributed populations.a. Construct a 95% confidence interval estimate of the mean amount of nicotine in cigarettes that are king size,
Pulse Rates Refer to Data Set 1 “Body Data” in Appendix B and construct a 95% confidence interval estimate of the mean pulse rate of adult females; then do the same for adult males. Compare the results.
Acupuncture for Migraines In a study designed to test the effectiveness of acupuncture for treating migraine, 142 subjects were treated with acupuncture and 80 subjects were given a sham treatment. The numbers of migraine attacks for the acupuncture treatment group had a mean of 1.8 and a standard
Echinacea Treatment In a study designed to test the effectiveness of echinacea for treating upper respiratory tract infections in children, 337 children were treated with echinacea and 370 other children were given a placebo. The numbers of days of peak severity of symptoms for the echinacea
Shoveling Heart Rates Because cardiac deaths appear to increase after heavy snowfalls, an experiment was designed to compare cardiac demands of snow shoveling to those of using an electric snow thrower. Ten subjects cleared tracts of snow using both methods, and their maximum heart rates (beats per
Caffeine in Soft Drinks Listed below are measured amounts of caffeine (mg per 12 oz of drink) obtained in one can from each of 20 brands (7-UP, A&W Root Beer, Cherry Coke,…, TaB). Use a confidence level of 99%. Does the confidence interval give us good information about the population of all cans
Years in College Listed below are the numbers of years it took for a random sample of college students to earn bachelor’s degrees (based on data from the National Center for Education Statistics). Construct a 95% confidence interval estimate of the mean time required for all college students to
Mercury in Sushi A Food and Drug Administration (FDA) guideline is that the mercury in fish should be below 1 part per million (ppm). Listed below are the amounts of mercury(ppm) found in tuna sushi sampled at different stores in New York City. The study was sponsored by the New York Times, and the
Lead in Medicine Listed below are the lead concentrations (in mg>g) measured in different Ayurveda medicines. Ayurveda is a traditional medical system commonly used in India.The lead concentrations listed here are from medicines manufactured in the United States. The data are based on the article
Cell Phone Radiation Listed below are the measured radiation emissions (in W>kg)corresponding to these cell phones: Samsung SGH-tss9, Blackberry Storm, Blackberry Curve, Motorola Moto, T-Mobile Sidekick, Sanyo Katana Eclipse, Palm Pre, Sony Ericsson, Nokia 6085, Apple iPhone 3GS, Kyocera Neo E1100.
Arsenic in Rice Listed below are amounts of arsenic (mg, or micrograms, per serving) in samples of brown rice from California (based on data from the Food and Drug Administration).Use a 90% confidence level. The Food and Drug Administration also measured amounts of arsenic in samples of brown rice
Genes Samples of DNA are collected, and the four DNA bases of A, G, C, and T are coded as 1, 2, 3, and 4, respectively. The results are listed below. Construct a 95% confidence interval estimate of the mean. What is the practical use of the confidence interval?2 2 1 4 3 3 3 3 4 1
Garlic for Reducing Cholesterol In a test of the effectiveness of garlic for lowering cholesterol, 49 subjects were treated with raw garlic. Cholesterol levels were measured before and after the treatment. The changes (before minus after) in their levels of low-density lipoprotein(LDL) cholesterol
Insomnia Treatment A clinical trial was conducted to test the effectiveness of the drug zopiclone for treating insomnia in older subjects. Before treatment with zopiclone, 16 subjects had a mean wake time of 102.8 min. After treatment with zopiclone, the 16 subjects had a mean wake time of 98.9 min
Atkins Weight Loss Program In a test of weight loss programs, 40 adults used the Atkins weight loss program. After 12 months, their mean weight loss was found to be 2.1 lb, with a standard deviation of 4.8 lb. Construct a 90% confidence interval estimate of the mean weight loss for all such
Mean Body Temperature Data Set 2 “Body Temperatures” in Appendix B includes a sample of 106 body temperatures having a mean of 98.20 F and a standard deviation of 0.62 F.Construct a 95% confidence interval estimate of the mean body temperature for the entire population.What does the result
Birth Weights of Boys Use these summary statistics for birth weights of 195 boys:x = 32.7 hg, s = 6.6 hg (based on Data Set 3 “Births” in Appendix B). Use a 95% confidence level. Are the results very different from those found in Exercise 9? Does it appear that boys and girls have very
Birth Weights of Girls Use these summary statistics given in Exercise 8: n = 205, x = 30.4 hg, s = 7.1 hg. Use a 95% confidence level. Are the results very different from those found in Example 2 with only 15 sample values?
Birth Weights Here are summary statistics for randomly selected weights of newborn girls:n = 205, x = 30.4 hg, s = 7.1 hg (based on Data Set 3 “Births” in Appendix B). The confidence level is 95%.
Vision Confidence level is 99%, s = 24.8, and the histogram of 61 right-eye vision measurements from a random sample of 61 adult males is shown in Exercise 6.
Normality Requirement What does it mean when we say that the confidence interval methods of this section are robust against departures from normality?
Interpreting a Confidence Interval The results in the screen display are based on a 95%confidence level. Write a statement that correctly interprets the confidence interval.
Degrees of Freedoma. What is the number of degrees of freedom that should be used for finding the critical value ta>2?b. Find the critical value ta>2 corresponding to a 95% confidence level.c. Give a brief general description of the number of degrees of freedom.
Hemoglobin Refer to the accompanying screen display.a. Express the confidence interval in the format that uses the “less than” symbol. If the original listed data use two decimal places, round the confidence interval limits accordingly.b. Identify the best point estimate of m and the margin of
Coping with No Success According to the Rule of Three, when we have a sample size n with x = 0 successes, we have 95% confidence that the true population proportion has an upper bound of 3>n. (See “A Look at the Rule of Three,” by Jovanovic and Levy, American Statistician, Vol. 51, No. 2.)a. If
One-Sided Confidence Interval A one-sided claim about a population proportion is a claim that the proportion is less than (or greater than) some specific value. Such a claim can be formally addressed using a one-sided confidence interval for p, which can be expressed as p 6 pn + E or p 7 pn - E,
Women Who Give Birth An epidemiologist plans to conduct a survey to estimate the percentage of women who give birth. How many women must be surveyed in order to be 99%confident that the estimated percentage is in error by no more than two percentage points?a. Assume that nothing is known about the
Vision Correction A manufacturing company is considering entering the new market of eyeglasses. How many people must be surveyed in order to be 90% confident that the estimated percentage of adults who wear eyeglasses is within three percentage points of the true population percentage?a. Assume
Nicotine Patches You plan to conduct a clinical trial to test the effectiveness of nicotine patch therapy in helping smokers to stop smoking. How many smokers must be included in order to be 99% confident that the estimate is in error by no more than two percentage points?a. Assume that nothing is
Biometric Security In considering the use of biometric security (such as fingerprints) to replace passwords, you want to estimate the percentage of adults who believe that passwords should be replaced with biometric security. How many randomly selected adults must you survey?Assume that you want to
Astrology A sociologist plans to conduct a survey to estimate the percentage of health care professionals who believe in astrology. How many health care professionals must be surveyed if we want a confidence level of 99% and a margin of error of four percentage points?a. Assume that nothing is
Bachelor’s Degree in Four Years In a study of government financial aid for college students, it becomes necessary to estimate the percentage of full-time college students who earn a bachelor’s degree in four years or less. Find the sample size needed to estimate that percentage.Use a 0.05
Chickenpox You plan to conduct a survey to estimate the percentage of adults who have had chickenpox. Find the number of people who must be surveyed if you want to be 90% confident that the sample percentage is within two percentage points of the true percentage for the population of all adults.a.
Lefties Find the sample size needed to estimate the percentage of California residents who are left-handed. Use a margin of error of three percentage points, and use a confidence level of 99%.a. Assume that pn and qn are unknown.b. Assume that based on prior studies, about 10% of Californians are
Measured Results vs. Reported Results The same study cited in the preceding exercise produced these results after six months for the 198 patients given sustained care: 25.8%were no longer smoking, and these results were biochemically confirmed, but 40.9% of these patients reported that they were no
Smoking Cessation In a program designed to help patients stop smoking, 198 patients were given sustained care, and 82.8% of them were no longer smoking after one month. Among 199 patients given standard care, 62.8% were no longer smoking after one month (based on data from “Sustained Care
Cloning Survey A Gallup poll included 1012 randomly selected adults who were asked whether “cloning of humans should or should not be allowed.” Results showed that 901 of those surveyed indicated that cloning should not be allowed. A news reporter wants to determine whether these survey results
Postponing Death An interesting hypothesis is that individuals can temporarily postpone their death to survive a major holiday or important event such as a birthday. In a study of this phenomenon, it was found that in the week before and the week after Thanksgiving, there were 12,000 total deaths,
Gender Selection Before its clinical trials were discontinued, the Genetics & IVF Institute conducted a clinical trial of the YSORT method designed to increase the probability of conceiving a boy and, among the 291 babies born to parents using the YSORT method, there were 239 boys. What do you
Gender Selection Before its clinical trials were discontinued, the Genetics & IVF Institute conducted a clinical trial of the XSORT method designed to increase the probability of conceiving a girl and, among the 945 babies born to parents using the XSORT method, there were 879 girls. Construct the
Lipitor In clinical trials of the drug Lipitor (atorvastatin), 270 subjects were given a placebo and 7 of them had allergic reactions. Among 863 subjects treated with 10 mg of the drug, 8 experienced allergic reactions. Construct the two 95% confidence interval estimates of the percentages of
Medication Usage In a survey of 3005 adults aged 57 through 85 years, it was found that 81.7% of them used at least one prescription medication (based on data from “Use of Prescription and Over-the-Counter Medications and Dietary Supplements Among Older Adults in the United States,” by Qato et
OxyContin The drug OxyContin (oxycodone) is used to treat pain, but it is dangerous because it is addictive and can be lethal. In clinical trials, 227 subjects were treated with OxyContin and 52 of them developed nausea (based on data from Purdue Pharma L.P.).a. Construct a 95% confidence interval
Mendelian Genetics One of Mendel’s famous genetics experiments yielded 580 peas, with 428 of them green and 152 yellow.a. Find a 99% confidence interval estimate of the percentage of green peas.b. Based on his theory of genetics, Mendel expected that 75% of the offspring peas would be green.
Births A random sample of 860 births in New York State included 426 boys. Construct a 95% confidence interval estimate of the proportion of boys in all births. It is believed that among all births, the proportion of boys is 0.512. Do these sample results provide strong evidence against that belief?
Medical Malpractice In a study of 1228 randomly selected medical malpractice lawsuits, it was found that 856 of them were dropped or dismissed (based on data from the Physicians Insurers Association of America). Construct a 95% confidence interval for the proportion of medical malpractice lawsuits
Survey Return Rate In a study of cell phone use and brain hemispheric dominance, an Internet survey was e-mailed to 5000 subjects randomly selected from an online group whose focus is related to ears. 717 surveys were returned. Construct a 90% confidence interval for the proportion of returned
Eliquis The drug Eliquis (apixaban) is used to help prevent blood clots in certain patients.In clinical trials, among 5924 patients treated with Eliquis, 153 developed the adverse reaction of nausea (based on data from Bristol-Myers Squibb Co.). Construct a 99% confidence interval for the
OxyContin In a clinical trial of OxyContin (oxycodone), 16 subjects experienced headaches among the 227 subjects treated with OxyContin. Construct a 95% confidence interval for the proportion of treated subjects who experience headaches.
Gray Eyes Express the confidence interval 0.070 { 0.021 in the form of pn - E 6 p 6 pn + E. Formats of Confidence Intervals. In Exercises 9–12, express the confidence interval using the indicated format. (The confidence intervals are based on proportions of eye colors.)
Green Eyes Express the confidence interval (0.0780, 0.162) in the form of pn - E 6 p 6 pn + E. Formats of Confidence Intervals. In Exercises 9–12, express the confidence interval using the indicated format. (The confidence intervals are based on proportions of eye colors.)
Blue Eyes Express 0.275 6 p 6 0.425 in the form of pn { E. Formats of Confidence Intervals. In Exercises 9–12, express the confidence interval using the indicated format. (The confidence intervals are based on proportions of eye colors.)
Brown Eyes Express 0.375 6 p 6 0.425 in the form of pn { E. Formats of Confidence Intervals. In Exercises 9–12, express the confidence interval using the indicated format. (The confidence intervals are based on proportions of eye colors.)
98% Finding Critical Values. In Exercises 5–8, find the critical value zA, 2 that corresponds to the given confidence level.
99.5% Finding Critical Values. In Exercises 5–8, find the critical value zA, 2 that corresponds to the given confidence level.
99% Finding Critical Values. In Exercises 5–8, find the critical value zA, 2 that corresponds to the given confidence level.
90% Finding Critical Values. In Exercises 5–8, find the critical value zA, 2 that corresponds to the given confidence level.
Confidence Levels Given specific sample data, such as the data given in Exercise 1, which confidence interval is wider: the 95% confidence interval or the 80% confidence interval? Why is it wider?
Notation For the poll described in Exercise 1, what values do pn, qn, n, E, and p represent? If the confidence level is 95%, what is the value of a?
Margin of Error For the poll described in Exercise 1, describe what is meant by the statement that “the margin of error was given as {4 percentage points.”
Reporting Results Here is a result stated in a format commonly used in the media: “In a clinical trial of 227 subjects treated with OxyContin (oxycodone), 13% of the subjects reported dizziness. The margin of error is {4 percentage points.” What important feature of the poll is omitted?
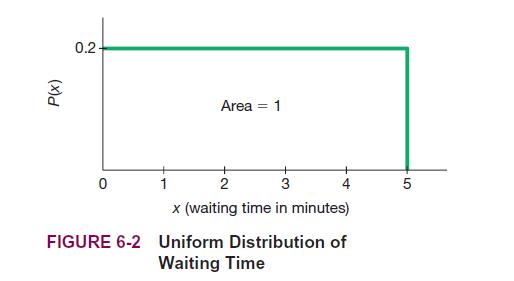
Greater than 3.00 minutes. Continuous Uniform Distribution. In Exercises 5–8, refer to the continuous uniform distribution depicted in Figure 6-2 and described in Example 1. Assume that a patient is randomly selected, and find the probability that the waiting time is within the given range. P(x)
Less than 4.00 minutes. Continuous Uniform Distribution. In Exercises 5–8, refer to the continuous uniform distribution depicted in Figure 6-2 and described in Example 1. Assume that a patient is randomly selected, and find the probability that the waiting time is within the given range. P(x) 0.2
Between 2 minutes and 3 minutes. Continuous Uniform Distribution. In Exercises 5–8, refer to the continuous uniform distribution depicted in Figure 6-2 and described in Example 1. Assume that a patient is randomly selected, and find the probability that the waiting time is within the given range.
Between 2.5 minutes and 4.5 minutes. Continuous Uniform Distribution. In Exercises 5–8, refer to the continuous uniform distribution depicted in Figure 6-2 and described in Example 1. Assume that a patient is randomly selected, and find the probability that the waiting time is within the given
Standard Normal Distribution. In Exercises 9–12, find the area of the shaded region.The graph depicts the standard normal distribution of bone density scores with mean 0 and standard deviation 1. z = 0.44
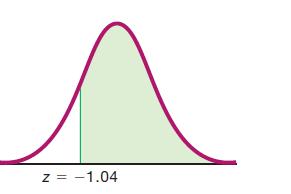
Standard Normal Distribution. In Exercises 9–12, find the area of the shaded region.The graph depicts the standard normal distribution of bone density scores with mean 0 and standard deviation 1. z = -1.04
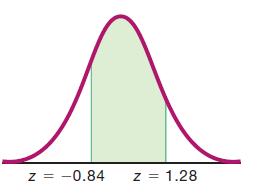
Standard Normal Distribution. In Exercises 9–12, find the area of the shaded region.The graph depicts the standard normal distribution of bone density scores with mean 0 and standard deviation 1. z = -0.84 z = 1.28
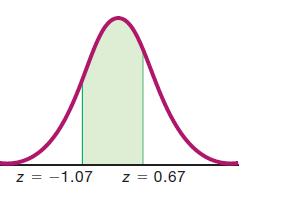
Standard Normal Distribution. In Exercises 9–12, find the area of the shaded region.The graph depicts the standard normal distribution of bone density scores with mean 0 and standard deviation 1. z = -1.07 Z = 0.67
Standard Normal Distribution. In Exercises 13–16, find the indicated z score. The graph depicts the standard normal distribution of bone density scores with mean 0 and standard deviation 1. 0.8907 0 N
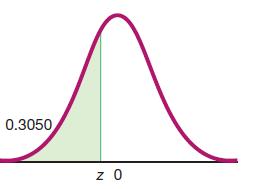
Standard Normal Distribution. In Exercises 13–16, find the indicated z score. The graph depicts the standard normal distribution of bone density scores with mean 0 and standard deviation 1. 0.3050 z O
Standard Normal Distribution. In Exercises 13–16, find the indicated z score. The graph depicts the standard normal distribution of bone density scores with mean 0 and standard deviation 1. N 0.9265 0
Standard Normal Distribution. In Exercises 13–16, find the indicated z score. The graph depicts the standard normal distribution of bone density scores with mean 0 and standard deviation 1. 0 z 0.2061
Distributions In a continuous uniform distribution,a. Find the mean and standard deviation for the distribution of the waiting times represented in Figure 6-2, which accompanies Exercises 5–8.b. For a continuous uniform distribution with m = 0 and s = 1, the minimum is -23 and the maximum is 23.
Birth Weights Based on Data Set 3 “Births” in Appendix B, birth weights are normally distributed with a mean of 3152.0 g and a standard deviation of 693.4 g.a. What are the values of the mean and standard deviation after converting all birth weights to z scores using z = 1x - m2>s?b. The
Birth Weights Based on Data Set 3 “Births” in Appendix B, birth weights are normally distributed with a mean of 3152.0 g and a standard deviation of 693.4 g.a. For the bell-shaped graph, what is the area under the curve?b. What is the value of the median?c. What is the value of the mode?d. What
Normal Distributions What is the difference between a standard normal distribution and a nonstandard normal distribution?
Random Digits Computers are commonly used to randomly generate digits of telephone numbers to be called when conducting the California Health Survey. Can the methods of this section be used to find the probability that when one digit is randomly generated, it is less than 3? Why or why not? What is
IQ Scores. In Exercises 5–8, find the area of the shaded region. The graphs depict IQ scores of adults, and those scores are normally distributed with a mean of 100 and a standard deviation of 15 (as on the Wechsler IQ test). 118
IQ Scores. In Exercises 5–8, find the area of the shaded region. The graphs depict IQ scores of adults, and those scores are normally distributed with a mean of 100 and a standard deviation of 15 (as on the Wechsler IQ test). 91
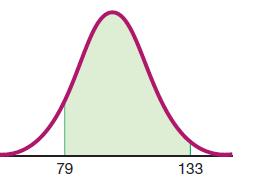
IQ Scores. In Exercises 5–8, find the area of the shaded region. The graphs depict IQ scores of adults, and those scores are normally distributed with a mean of 100 and a standard deviation of 15 (as on the Wechsler IQ test). 79 133
IQ Scores. In Exercises 5–8, find the area of the shaded region. The graphs depict IQ scores of adults, and those scores are normally distributed with a mean of 100 and a standard deviation of 15 (as on the Wechsler IQ test). 112 124
IQ Scores. In Exercises 9–12, find the indicated IQ score and round to the nearest whole number. The graphs depict IQ scores of adults, and those scores are normally distributed with a mean of 100 and a standard deviation of 15 (as on the Wechsler IQ test). 0.9918 X
IQ Scores. In Exercises 9–12, find the indicated IQ score and round to the nearest whole number. The graphs depict IQ scores of adults, and those scores are normally distributed with a mean of 100 and a standard deviation of 15 (as on the Wechsler IQ test). X 0.1587
IQ Scores. In Exercises 9–12, find the indicated IQ score and round to the nearest whole number. The graphs depict IQ scores of adults, and those scores are normally distributed with a mean of 100 and a standard deviation of 15 (as on the Wechsler IQ test). x 0.9798
IQ Scores. In Exercises 9–12, find the indicated IQ score and round to the nearest whole number. The graphs depict IQ scores of adults, and those scores are normally distributed with a mean of 100 and a standard deviation of 15 (as on the Wechsler IQ test). 0.9099 x
Find the probability of a pulse rate less than 100 beats per minute. Female Pulse Rates. In Exercises 13–20, assume that an adult female is randomly selected. Females have pulse rates that are normally distributed with a mean of 74.0 beats per minute and a standard deviation of 12.5 beats per
Find the probability of a pulse rate greater than 80 beats per minute. Female Pulse Rates. In Exercises 13–20, assume that an adult female is randomly selected. Females have pulse rates that are normally distributed with a mean of 74.0 beats per minute and a standard deviation of 12.5 beats per
Find the probability of a pulse rate between 60 beats per minute and 70 beats per minute. Female Pulse Rates. In Exercises 13–20, assume that an adult female is randomly selected. Females have pulse rates that are normally distributed with a mean of 74.0 beats per minute and a standard deviation
Find the probability of a pulse rate between 70 beats per minute and 90 beats per minute. Female Pulse Rates. In Exercises 13–20, assume that an adult female is randomly selected. Females have pulse rates that are normally distributed with a mean of 74.0 beats per minute and a standard deviation
Showing 4700 - 4800
of 5191
First
38
39
40
41
42
43
44
45
46
47
48
49
50
51
52
Step by Step Answers