New Semester
Started
Get
50% OFF
Study Help!
--h --m --s
Claim Now
Question Answers
Textbooks
Find textbooks, questions and answers
Oops, something went wrong!
Change your search query and then try again
S
Books
FREE
Study Help
Expert Questions
Accounting
General Management
Mathematics
Finance
Organizational Behaviour
Law
Physics
Operating System
Management Leadership
Sociology
Programming
Marketing
Database
Computer Network
Economics
Textbooks Solutions
Accounting
Managerial Accounting
Management Leadership
Cost Accounting
Statistics
Business Law
Corporate Finance
Finance
Economics
Auditing
Tutors
Online Tutors
Find a Tutor
Hire a Tutor
Become a Tutor
AI Tutor
AI Study Planner
NEW
Sell Books
Search
Search
Sign In
Register
study help
business
biostatistics
Biostatistics For The Biological And Health Sciences 2nd Edition Marc Triola, Mario Triola, Jason Roy - Solutions
Find P90, which is the pulse rate separating the bottom 90% from the top 10%. Female Pulse Rates. In Exercises 13–20, assume that an adult female is randomly selected. Females have pulse rates that are normally distributed with a mean of 74.0 beats per minute and a standard deviation of 12.5
Find the first quartile Q1, which is the pulse rate separating the bottom 25% from the top 75%. Female Pulse Rates. In Exercises 13–20, assume that an adult female is randomly selected. Females have pulse rates that are normally distributed with a mean of 74.0 beats per minute and a standard
Significance Instead of using 0.05 for identifying significant values, use the criteria that a value x is significantly high if P(x or greater) … 0.01 and a value is significantly low if P(x or less) … 0.01. Find the pulse rates separating significant values from those that are not significant.
Significance Instead of using 0.05 for identifying significant values, use the criteria that a value x is significantly high if P(x or greater) … 0.025 and a value is significantly low if P(x or less) … 0.025. Find the pulse rates separating significant values from those that are not
Eye Contact In a study of facial behavior, people in a control group are timed for eye contact in a 5-minute period. Their times are normally distributed with a mean of 184.0 seconds and a standard deviation of 55.0 seconds (based on data from “Ethological Study of Facial Behavior in Nonparanoid
Body Temperatures Based on sample results in Data Set 2 “Body Temperatures” in Appendix B, assume that human body temperatures are normally distributed with a mean of 98.20 F and a standard deviation of 0.62 F.a. According to emedicinehealth.com, a body temperature of 100.4oF or above is
Low Birth Weight The University of Maryland Medical Center considers “low birth weights” to be those less than 5.5 lb or 2495 g. Birth weights are normally distributed with a mean of 3152.0 g and a standard deviation of 693.4 g (based on Data Set 3 “Births” in Appendix B).a. If a birth
Durations of Pregnancies The lengths of pregnancies are normally distributed with a mean of 268 days and a standard deviation of 15 days.a. In a letter to “Dear Abby,” a wife claimed to have given birth 308 days after a brief visit from her husband, who was working in another country. Find the
Diastolic Blood Pressure of Males Refer to Data Set 1 in Appendix B and use the diastolic blood pressures of males.a. Find the mean and standard deviation, and verify that the data have a distribution that is roughly normal. Round the results using three decimal places.b. Treating the unrounded
Diastolic Blood Pressure of Females Repeat the preceding exercise using females instead of males.
Outliers For the purposes of constructing modified boxplots as described in Section 3-3, outliers are defined as data values that are above Q3 by an amount greater than 1.5 * IQR or below Q1 by an amount greater than 1.5 * IQR, where IQR is the interquartile range. Using this definition of
19. Using a Formula to Describe a Sampling Distribution Exercise 15 “Births” requires the construction of a table that describes the sampling distribution of the proportions of girls from two births. Consider the formula shown here, and evaluate that formula using sample proportions
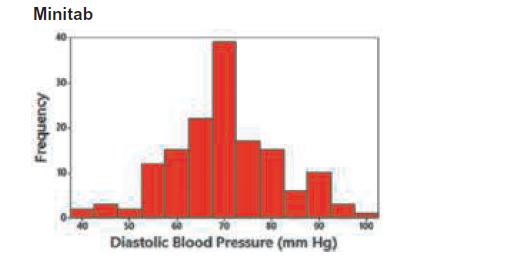
Assessing Normality The accompanying histogram is constructed from the diastolic blood pressure measurements of the 147 women included in Data Set 1 “Body Data” in Appendix B. If you plan to conduct further statistical tests and there is a loose requirement of a normally distributed population,
Head Lengths of Bears The normal quantile plot represents the head lengths (in.) of bears listed in Data Set 11 “Bear Measurements.” z score 24 1.0 12 24 106 114 122 X Values 138 148 154 152 17
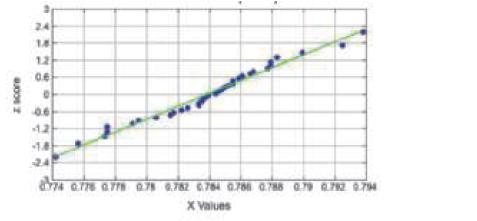
Diet Pepsi The normal quantile plot represents weights (pounds) of the contents of cans of Diet Pepsi. 24 18 12 I score 06 O N06 12 1.4 24 8774 0.776 077 0.75 0.782 0.764 0.78 0.788 0.79 0.782 0794 X Values
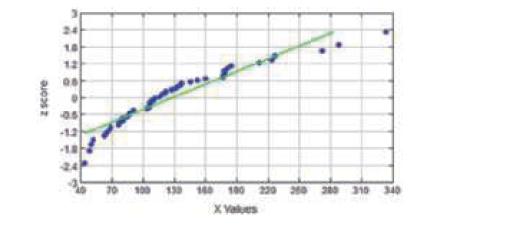
Patient Service Times The normal quantile plot represents service times (minutes) of randomly selected patients. 2 score 24 14 12 195 -18 130 140 100 220 260 280 310 340 X Values
Visual Acuity Data Set 5 “Vision” includes measures of visual acuity. Shown here is the normal quantile plot resulting from the listed measurements from the right eye of the 300 subjects. Z. SCOF 24 18 12 0. 12 24 M 110 120 X Values 154 182 200
Bone Density Test A bone mineral density test is used to identify a bone disease. The result of a bone density test is commonly measured as a z score, and the population of z scores is normally distributed with a mean of 0 and a standard deviation of 1.a. For a randomly selected subject, find the
Biometric Security In designing a security system based on eye (iris) recognition, we must consider the standing eye heights of women, which are normally distributed with a mean of 59.7 in. and a standard deviation of 2.5 in. (based on anthropometric survey data from Gordon, Churchill, et al.).a.
Biometric Security Standing eye heights of men are normally distributed with a mean of 64.3 in. and a standard deviation of 2.6 in. (based on anthropometric survey data from Gordon, Churchill, et al.).a. If an eye recognition security system is positioned at a height that is uncomfortable for men
Sampling Distributions Scores on the Gilliam Autism Rating Scale (GARS) are normally distributed with a mean of 100 and a standard deviation of 15. A sample of 64 GARS scores is randomly selected and the sample mean is computed.a. Describe the distribution of such sample means.b. What is the mean
Unbiased Estimatorsa. What is an unbiased estimator?b. For the following statistics, identify those that are unbiased estimators: mean, median, range, variance, proportion.c. Determine whether the following statement is true or false: “The sample standard deviation is a biased estimator, but the
Disney Monorail The Mark VI monorail used at Disney World has doors with a height of 72 in. Heights of men are normally distributed with a mean of 68.6 in. and a standard deviation of 2.8 in. (based on Data Set 1 “Body Data” in Appendix B).a. What percentage of adult men can fit through the
Disney Monorail Consider the same Mark VI monorail described in the preceding exercise.Again assume that heights of men are normally distributed with a mean of 68.6 in. and a standard deviation of 2.8 in.a. In determining the suitability of the monorail door height, why does it make sense to
Assessing Normality of BMI Data Listed below are measures of body mass index(BMI) for women listed in Data Set 1 “Body Data.”a. Do these measures appear to come from a population that has a normal distribution? Why or why not?b. Can the mean of this sample be treated as a value from a
Hybridization Experiment In one of Mendel’s experiments with plants, 1064 offspring consisted of 787 plants with long stems. According to Mendel’s theory, 3>4 of the offspring plants should have long stems. Assuming that Mendel’s proportion of 3>4 is correct, find the probability of getting
Tall Clubs The social organization Tall Clubs International has a requirement that women must be at least 70 in. tall. Assume that women have normally distributed heights with a mean of 63.7 in. and a standard deviation of 2.9 in. (based on Data Set 1 in Appendix B).a. Find the percentage of women
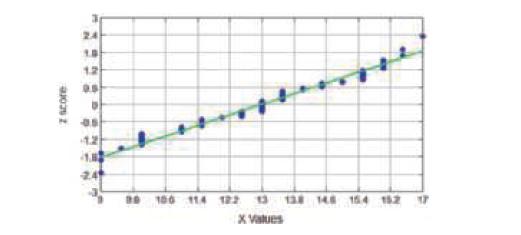
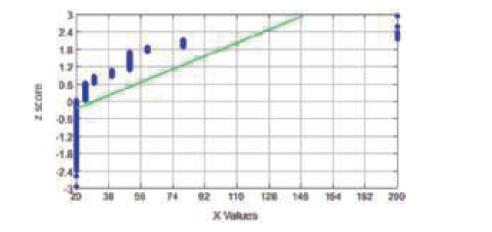
Diastolic Blood Pressure The accompanying normal quantile plot was constructed from the diastolic blood pressure levels of a sample of women. What does this graph suggest about diastolic blood pressure levels of women?
Diastolic Blood Pressure If 16 women are randomly selected, find the probability that the mean of their diastolic blood pressure levels is less than 75 mm Hg.
Diastolic Blood Pressure Find P90, the 90th percentile for the diastolic blood pressure levels of women.
Diastolic Blood Pressure Find the probability that a randomly selected woman has a diastolic blood pressure level between 60 mm Hg and 80 mm Hg.
Diastolic Blood Pressure Find the probability that a randomly selected woman has a normal diastolic blood pressure level, which is below 80 mm Hg.
Notationa. Identify the values of m and s for the standard normal distribution.b. What do the symbols mx and sx represent?
Bone Density For a randomly selected subject, find the probability of a score between 0.87 and 1.78.
Bone Density For a randomly selected subject, find the probability of a score greater than-2.93.
Bone Density Find the score separating the lowest 9% of scores from the highest 91%.
Bone Density Sketch a graph showing the shape of the distribution of bone density test scores.
16. Cell Phones and Brain Cancer In a study of 420,095 cell phone users in Denmark, it was found that 135 developed cancer of the brain or nervous system. For those not using cell phones, there is a 0.000340 probability of a person developing cancer of the brain or nervous system. We therefore
Sleepwalking Assume that 29.2% of people have sleepwalked (based on “Prevalence and Comorbidity of Nocturnal Wandering in the U.S. Adult General Population,” by Ohayon et al., Neurology, Vol. 78, No. 20). Assume that in a random sample of 1480 adults, 455 have sleepwalked.a. Assuming that the
Mendelian Genetics When Mendel conducted his famous genetics experiments with peas, one sample of offspring consisted of 929 peas, with 705 of them having red flowers. If we assume, as Mendel did, that under these circumstances, there is a 3>4 probability that a pea will have a red flower, we would
13. Tamiflu Assume that 10% of subjects treated with Tamiflu (oseltamivir) experienced the adverse reaction of nausea (based on clinical trials).a. Find the probability that among 250 randomly selected subjects treated with Tamiflu, exactly 17 of them experience nausea.b. Find the probability that
12. Brown Eyes Find the probability that among the 100 subjects, 33 or fewer have brown eyes. Is 33 people with brown eyes significantly low? Eye Colors. In Exercises 9–12, assume that eye colors are distributed as shown in the accompanying display (based on data from a study by Dr. P. Sorita at
11. Green Eyes Find the probability that fewer than 5 of the 100 subjects have green eyes. Is 4 people with green eyes significantly low? Eye Colors. In Exercises 9–12, assume that eye colors are distributed as shown in the accompanying display (based on data from a study by Dr. P. Sorita at
10. Blue Eyes Find the probability that at least 49 of the 100 subjects have blue eyes. Is 49 people with blue eyes significantly high? Eye Colors. In Exercises 9–12, assume that eye colors are distributed as shown in the accompanying display (based on data from a study by Dr. P. Sorita at
Blue Eyes Find the probability that at least 40 of the 100 subjects have blue eyes. Is 40 people with blue eyes significantly high? Eye Colors. In Exercises 9–12, assume that eye colors are distributed as shown in the accompanying display (based on data from a study by Dr. P. Sorita at Indiana
8. Guessing on United States Medical Licensing Examinations With n = 50 guesses and p = 0.2 for a correct answer, find P(exactly 12 correct answers).Using Normal Approximation. In Exercises 5–8, do the following: If the requirements of np # 5 and nq # 5 are both satisfied, estimate the indicated
7. Guessing on United States Medical Licensing Examinations With n = 20 guesses and p = 0.2 for a correct answer, find P(at least 6 correct answers). Using Normal Approximation. In Exercises 5–8, do the following: If the requirements of np # 5 and nq # 5 are both satisfied, estimate the indicated
6. Births of Boys With n = 8 births and p = 0.512 for a boy, find P(exactly 5 boys). Using Normal Approximation. In Exercises 5–8, do the following: If the requirements of np # 5 and nq # 5 are both satisfied, estimate the indicated probability by using the normal distribution as an approximation
5. Births of Boys With n = 20 births and p = 0.512 for a boy, find P(fewer than 8 boys). Using Normal Approximation. In Exercises 5–8, do the following: If the requirements of np # 5 and nq # 5 are both satisfied, estimate the indicated probability by using the normal distribution as an
4. Distribution of Proportions Each week, Nielsen Media Research conducts a survey of 5000 households and records the proportion of households tuned to Sanjay Gupta MD. If we obtain a large collection of those proportions and construct a histogram of them, what is the approximate shape of the
3. Notation Common tests such as the SAT, ACT, LSAT, and MCAT tests use multiple choice test questions, each with possible answers ofa, b,c, d,e, and each question has only one correct answer. For people who make random guesses for answers to a block of 100 questions, identify the values of p, q,
Checking Requirements Common tests such as the SAT, ACT, LSAT (Law School Admissions Test), and MCAT (Medical College Admissions Test) use multiple choice test questions, each with possible answers ofa, b,c, d,e, and each question has only one correct answer. We want to find the probability of
Continuity Correction In testing the assumption that the probability of a baby boy is 0.512, a geneticist obtains a random sample of 1000 births and finds that 502 of them are boys.Using the continuity correction, describe the area under the graph of a normal distribution corresponding to the
Lognormal Distribution The following are costs (dollars) of treating patients. Test these values for normality, then take the logarithm of each value and test for normality. What do you conclude?237,592 160,680 153,500 117,120 7304 6037 4483 4367 2658 1361 31
Transformations The heights (in inches) of men listed in Data Set 1 “Body Data” in Appendix B have a distribution that is approximately normal, so it appears that those heights are from a normally distributed population.a. If 2 inches is added to each height, are the new heights also normally
Brain Volumes A sample of human brain volumes (cm3) is obtained from those listed in Data Set 9 “IQ and Brain Size” from Appendix B: 1272, 1051, 1079, 1034, 1070, 1173, 1079, 1067. Constructing Normal Quantile Plots. In Exercises 17 and 18, use the given data values to identify the
Female Arm Circumferences A sample of arm circumferences (cm) of females from Data Set 1 “Body Data” in Appendix B: 40.7, 44.3, 34.2, 32.5, 38.5. Constructing Normal Quantile Plots. In Exercises 17 and 18, use the given data values to identify the corresponding z scores that are used for a
Red blood cell counts of females from Data Set 1 “Body Data” in Appendix B. Using Technology to Generate Normal Quantile Plots. In Exercises 13–16, use technology to generate a normal quantile plot. Then determine whether the data come from a normally distributed population.
White blood cell counts of females from Data Set 1 “Body Data” in Appendix B. Using Technology to Generate Normal Quantile Plots. In Exercises 13–16, use technology to generate a normal quantile plot. Then determine whether the data come from a normally distributed population.
Lengths of stay from Data Set 3 “Births” in Appendix B. Using Technology to Generate Normal Quantile Plots. In Exercises 13–16, use technology to generate a normal quantile plot. Then determine whether the data come from a normally distributed population.
Birth weights from Data Set 3 “Births” in Appendix B. Using Technology to Generate Normal Quantile Plots. In Exercises 13–16, use technology to generate a normal quantile plot. Then determine whether the data come from a normally distributed population.
Bears The neck sizes of bears, as listed in Data Set 11 “Bear Measurements” in Appendix B. Determining Normality. In Exercises 9–12, refer to the indicated sample data and determine whether they appear to be from a population with a normal distribution. Assume that this requirement is loose
Cuckoo Egg Lengths The lengths of cuckoo eggs in wren nests, as listed in Data Set 17“Cuckoo Egg Lengths” in Appendix B. Determining Normality. In Exercises 9–12, refer to the indicated sample data and determine whether they appear to be from a population with a normal distribution. Assume
Births The lengths of stay (days) of newborn babies, as listed in Data Set 3 “Births” in Appendix B. Determining Normality. In Exercises 9–12, refer to the indicated sample data and determine whether they appear to be from a population with a normal distribution. Assume that this requirement
Irises The petal lengths of irises, as listed in Data Set 16 “Iris Measurements” in Appendix B. Determining Normality. In Exercises 9–12, refer to the indicated sample data and determine whether they appear to be from a population with a normal distribution. Assume that this requirement is
Small Sample An article includes elapsed times (hours) to lumbar puncture for 19 patients who entered emergency rooms with sudden and severe “thunderclap” headaches (based on data from “Thunderclap Headache and Normal Computed Tomographic Results: Value of Cerebrospinal Fluid Analysis,” by
Normal Quantile Plot After constructing a histogram of the ages of the 147 women included in Data Set 1 “Body Data” in Appendix B, you see that the histogram is far from being bell-shaped. What do you now know about the pattern of points in the normal quantile plot?
Normal Quantile Plot Data Set 1 “Body Data” in Appendix B includes the heights of 147 randomly selected women, and heights of women are normally distributed. If you were to construct a histogram of the 147 heights of women in Data Set 1, what shape do you expect the histogram to have? If you
Correcting for a Finite Population In a study of babies born with very low birth weights, 275 children were given IQ tests at age 8, and their scores approximated a normal distribution with m = 95.5 and s = 16.0 (based on data from “Neurobehavioral Outcomes of School-Age Children Born Extremely
Loading Aircraft Before every flight, the pilot must verify that the total weight of the load is less than the maximum allowable load for the aircraft. The Bombardier Dash 8 aircraft can carry 37 passengers, and a flight has fuel and baggage that allows for a total passenger load of 6200 lb. The
Doorway Height The Boeing 757-200 ER airliner carries 200 passengers and has doors with a height of 72 in. Heights of men are normally distributed with a mean of 68.6 in. and a standard deviation of 2.8 in. (based on Data Set 1 “Body Data” in Appendix B).a. If a male passenger is randomly
Redesign of Ejection Seats When women were finally allowed to become pilots of fighter jets, engineers needed to redesign the ejection seats because they had been originally designed for men only. The ACES-II ejection seats were designed for men weighing between 140 lb and 211 lb. Weights of women
Southwest Airlines Seats Southwest Airlines currently has a seat width of 17 in. Men have hip breadths that are normally distributed with a mean of 14.4 in. and a standard deviation of 1.0 in. (based on anthropometric survey data from Gordon, Churchill, et al.).a. Find the probability that if an
Designing Manholes According to the website www.torchmate.com, “manhole covers must be a minimum of 22 in. in diameter, but can be as much as 60 in. in diameter.” Assume that a manhole is constructed to have a circular opening with a diameter of 22 in. Men have shoulder breadths that are
Sleep The amounts of times that adults sleep are normally distributed with a mean of 6.8 hours and a standard deviation of 1.4 hours (based on data from multiple sources, including a Gallup poll and the American Journal of Epidemiology). A common recommendation is that we get between 7 and 9 hours
Diastolic BP in Men Diastolic blood pressure is a measure of the pressure when arteries rest between heartbeats. Diastolic blood pressure levels in men are normally distributed with a mean of 71.3 mm Hg and a standard deviation of 12.0 mm Hg (based on Data Set 1 “Body Data” in Appendix B).a. A
Diastolic BP in Women Diastolic blood pressure is a measure of the pressure when arteries rest between heartbeats. Diastolic blood pressure levels in women are normally distributed with a mean of 70.2 mm Hg and a standard deviation of 11.2 mm Hg (based on Data Set 1“Body Data” in Appendix B).a.
Hemoglobin in Women Hemoglobin levels in adult females are normally distributed with a mean of 13.0 g>dL and a standard deviation of 1.3 g>dL (based on data from the National Health and Nutrition Examination Survey).a. The normal hemoglobin range for women is 12.1 g>dL to 15.1 g>dL. What percentage
Hemoglobin in Men Hemoglobin levels in adult males are normally distributed with a mean of 14.7 g>dL and a standard deviation of 1.3 g>dL (based on data from the National Health and Nutrition Examination Survey).a. The normal hemoglobin range for men is 13.6 g>dL to 17.7 g>dL. What percentage of
8.a. If 1 adult female is randomly selected, find the probability that her pulse rate is between 78 beats per minute and 90 beats per minute.b. If 16 adult females are randomly selected, find the probability that they have pulse rates with a mean between 78 beats per minute and 90 beats per
7.a. If 1 adult female is randomly selected, find the probability that her pulse rate is between 72 beats per minute and 76 beats per minute.b. If 4 adult females are randomly selected, find the probability that they have pulse rates with a mean between 72 beats per minute and 76 beats per
6.a. If 1 adult female is randomly selected, find the probability that her pulse rate is greater than 70 beats per minute.b. If 25 adult females are randomly selected, find the probability that they have pulse rates with a mean greater than 70 beats per minute.c. Why can the normal distribution be
5.a. If 1 adult female is randomly selected, find the probability that her pulse rate is less than 80 beats per minute.b. If 16 adult females are randomly selected, find the probability that they have pulse rates with a mean less than 80 beats per minute.c. Why can the normal distribution be used
Annual Incomes Annual incomes of physicians are known to have a distribution that is skewed to the right instead of being normally distributed. Assume that we collect a large 1n 7 302 random sample of annual incomes of physicians. Can the distribution of those incomes in that sample be approximated
Notation In general, what do the symbols mx and sx represent? What are the values of mx and sx for samples of size 64 randomly selected from the population of IQ scores with population mean of 100 and standard deviation of 15?
Small Sample Weights of adult human brains are normally distributed. Samples of weights of adult human brains, each of size n = 15, are randomly collected and the sample means are found. Is it correct to conclude that the sample means cannot be treated as being from a normal distribution because
Requirements A researcher collects a simple random sample of grade-point averages of biostatistics students and she calculates the mean of this sample. Under what conditions can that sample mean be treated as a value from a population having a normal distribution?
20. Mean Absolute Deviation Is the mean absolute deviation of a sample a good statistic for estimating the mean absolute deviation of the population? Why or why not? (Hint: See Example 5.)
Hybridization A hybridization experiment begins with four peas having yellow pods and one pea having a green pod. Two of the peas are randomly selected with replacement from this population.a. After identifying the 25 different possible samples, find the proportion of peas with yellow pods in each
MCAT Tests Because they enable efficient procedures for evaluating answers, multiple choice questions are commonly used on standardized tests, such as the MCAT or the GRE Biology test.Such questions typically have five choices, one of which is correct. Assume that you must make random guesses for
Births: Sampling Distribution of Sample Proportion For three births, assume that the genders are equally likely. Construct a table that describes the sampling distribution of the sample proportion of girls from three births. Does the mean of the sample proportions equal the proportion of girls in
Births: Sampling Distribution of Sample Proportion When two births are randomly selected, the sample space for genders is bb, bg, gb, and gg (where b = boy and g =girl). Assume that those four outcomes are equally likely. Construct a table that describes the sampling distribution of the sample
Sampling Distribution of the Variance Repeat Exercise 11 using variances instead of means.
Sampling Distribution of the Range Repeat Exercise 11 using ranges instead of means.
Sampling Distribution of the Median Repeat Exercise 11 using medians instead of means.
Sampling Distribution of the Sample Meana. After identifying the 16 different possible samples, find the mean of each sample, then construct a table representing the sampling distribution of the sample mean. In the table, combine values of the sample mean that are the same. (Hint: See Table 6-3 in
Sampling Distribution of the Sample Proportiona. For the population, find the proportion of odd numbers.b. Table 6-2 describes the sampling distribution of the sample mean. Construct a similar table representing the sampling distribution of the sample proportion of odd numbers. Then combine values
Sampling Distribution of the Sample Mediana. Find the value of the population median.b. Table 6-2 describes the sampling distribution of the sample mean. Construct a similar table representing the sampling distribution of the sample median. Then combine values of the median that are the same, as in
Sampling Distribution of the Sample Standard Deviation For the following, round results to three decimal places.a. Find the value of the population standard deviation s.b. Table 6-2 describes the sampling distribution of the sample mean. Construct a similar table representing the sampling
Sampling Distribution of the Sample Variancea. Find the value of the population variance s2.b. Table 6-2 describes the sampling distribution of the sample mean. Construct a similar table representing the sampling distribution of the sample variance s2. Then combine values of s2 that are the same,
Showing 4800 - 4900
of 5191
First
38
39
40
41
42
43
44
45
46
47
48
49
50
51
52
Step by Step Answers