New Semester
Started
Get
50% OFF
Study Help!
--h --m --s
Claim Now
Question Answers
Textbooks
Find textbooks, questions and answers
Oops, something went wrong!
Change your search query and then try again
S
Books
FREE
Study Help
Expert Questions
Accounting
General Management
Mathematics
Finance
Organizational Behaviour
Law
Physics
Operating System
Management Leadership
Sociology
Programming
Marketing
Database
Computer Network
Economics
Textbooks Solutions
Accounting
Managerial Accounting
Management Leadership
Cost Accounting
Statistics
Business Law
Corporate Finance
Finance
Economics
Auditing
Tutors
Online Tutors
Find a Tutor
Hire a Tutor
Become a Tutor
AI Tutor
AI Study Planner
NEW
Sell Books
Search
Search
Sign In
Register
study help
business
business statistics communicating
Basic Business Statistics Concepts And Applications 13th Global Edition Mark Berenson, David Levine, Kathryn Szabat - Solutions
One of the major measures of the quality of service provided by an organization is the speed with which the organization responds to customer complaints. A large family-held department store selling furniture and flooring, including carpet, had undergone a major expansion in the past several years.
The Air Travel Consumer Report, a monthly product of the Department of Transportation’s Office of Aviation Enforcement and Proceedings (OAEP), is designed to assist consumers with information on the quality of services provided by airlines. The report includes a summary of consumer complaints by
The following data represent the pounds per capita of fresh food and packaged food consumed in the United States, Japan, and Russia in a recent year:a. For the United States, Japan, and Russia, construct a bar chart, a pie chart, and a Pareto chart for different types of fresh foods consumed.b. For
Suppose that the owner of the restaurant in Problem 2.83 also wants to study the demand for dessert during the same time period. She decides that in addition to studying whether a dessert was ordered, she will also study the gender of the individual and whether a beef entrée was ordered. Data were
The owner of a restaurant that serves Continental-style entrées has the business objective of learning more about the patterns of patron demand during the Friday-to-Sunday weekend time period. Data were collected from 630 customers on the type of entrée ordered and organized in the following
A survey was conducted from 665 consumer magazines on the practices of their websites. The results are summarized in a copyediting table and a fact-checking table:
The following table represents the market share (in number of movies, gross in millions of dollars, and millions of tickets sold) of each type of movie in 2012:
The following summary, table, presents the breakdown of the price of a new college textbook:
What type of insights can you gain from a contingency table that contains three variables that you cannot gain from a contingency table that contains two variables?
How can a multidimensional table differ from a two-variable contingency table?
What are the class boundaries in frequency distribution? Why it is important to properly define class boundaries?
Why is it said that the main feature of a Pareto chart is its ability to separate the “vital few” from the “trivial many”?
How does a side-by-side bar chart present data better than a contingencies table?
Compare and contrast the bar chart for categorical data with the histogram for numerical data.
How is a Pareto chart a better representation of data in comparison to a pie chart?
How do you determine class intervals in frequency distribution?
Is diagrammatic presentation of data better than tabulation of data? Why or why not?
show a bar chart and a pie chart for the risk level for the retirement fund data (see page 80).a. Create an exploded pie chart, a doughnut chart, a cone chart, and a pyramid chart that shows the risk level of retirement funds.b. Which graphs do you prefer—the bar chart or pie chart or the
shows a bar chart and a pie chart for the main reason young adults shop online (see page 79).a. Create an exploded pie chart, a doughnut chart, a cone chart, or a pyramid chart that shows the main reason young adults shop online.b. Which graphs do you prefer—the bar chart or pie chart or the
Professor Deanna Oxender Burgess of Florida Gulf Coast University conducted research on annual reports of corporations (see D. Rosato, “Worried About the Numbers? How About the Charts?” The New York Times, September 15, 2002, p. B7).Burgess found that even slight distortions in a chart changed
Examine the following visualization, adapted a management consulting white paper.a. Describe at least one good feature of this visual display.b. Describe at least one bad feature of this visual display.c. Redraw the graph, using the guidelines given on page 102.
Examine the following visualization, adapted from one that appeared in the post “Who Are the Comic Book Fans on Facebook?” on February 2, 2013, as reported by graphicspolicy.com.
Examine the visualization at the top of the next column, adapted from one that appeared in a post in a digital marketing blog.a. Describe at least one good feature of this visual display.b. Describe at least one bad feature of this visual display.c. Redraw the graph, using the guidelines above.
(Student Project) The Data and Story Library (DASL) is an online library of data files and stories that illustrate the use of basic statistical methods. Go to lib.stat.cmu.edu/index.php, click DASL, and explore some of the various graphical displays.a. Select a graphical display that you think does
(Student Project) Bring to class a chart from a website, newspaper, or magazine published this month that you believe to be a poorly drawn representation of a categorical variable. Be prepared to submit the chart to the instructor with comments about why you consider it inappropriate. Do you
(Student Project) Bring to class a chart from a website, newspaper, or magazine published recently that you believe to be a poorly drawn representation of a numerical variable. Be prepared to submit the chart to the instructor with comments about why you believe it is inappropriate. Do you believe
Using the sample of retirement funds stored in RetirementFunds :a. Construct a table that tallies type, market cap, risk, and rating.b. What conclusions can you reach concerning differences among the types of funds based on market cap (small, mid-cap, and large), based on type (growth and value),
Using the sample of retirement funds stored in RetirementFunds :a. Construct a table that tallies type, risk, and rating.b. What conclusions can you reach concerning differences among the types of retirement funds (growth and value), based on the risk (low, average, and high), and the rating (one,
Using the sample of retirement funds stored in RetirementFunds :a. Construct a table that tallies market cap, risk, and rating.b. What conclusions can you reach concerning differences among the types of funds based on market cap (small, mid-cap, and large), risk (low, average, and high), and the
Using the sample of retirement funds stored in RetirementFunds :a. Construct a table that tallies type, market cap, and rating.b. What conclusions can you reach concerning differences among the types of retirement funds (growth and value), based on market cap (small, mid-cap, and large) and the
The file Audits contains the number of audits of corporations with assets of more than $250 million conducted by the Internal Revenue Service between 2001 and 2012. (Data extracted from www.irs.gov.)a. Construct a time-series plot.b. What pattern, if any, is present in the data?
The file Movie Attendance contains the yearly movie attendance (in billions) from 2001 through 2012:
The data in NewHomeSales represent number and median sales price of new single-family houses sold in the United States recorded at the end of each month from January 2000 through December 2012. (Data extracted from www.census.gov, February 24, 2013.)a. Construct a times series plot of new home
How have stocks performed in the past? The following table presents the data stored in Stock Performance and shows the performance of a broad measure of stocks (by percentage) for each decade from the 1830s through the 2000s:
A Pew Research Center survey found that social networking is popular in many nations around the world. The file Global SocialMedia contains the level of social media networking (measured as the percentage of individuals polled who use social networking sites) and the GDP at purchasing power parity
College football is big business, with coaches’ pay and revenues in millions of dollars. The file College Football contains the coaches’ total pay and net revenue for college football at 105 schools (Data extracted from “College Football Coaches Continue to See Salary Explosion,” USA Today,
Data were collected on the typical cost of dining at American-cuisine restaurants within a 1-mile walking distance of a hotel located in a large city. The file Bundle contains the typical cost (a per transaction cost in $) as well as a Bundle score, a measure of overall popularity and customer
Movie companies need to predict the gross receipts of individual movies once a movie has debuted.The following results, stored in PotterMovies , are the first weekend gross, the U.S. gross, and the worldwide gross (in $millions)of the eight Harry Potter movies:
17.0 13.0a. Construct a time-series plot.b. Does there appear to be any change in annual sales over time?Explain.
The following is a series of annual sales (in $millions) over an 11-year period (2002 to 2012):Year: 2002 2003 2004 2005 2006 2007 2008 2009 2010 2011 2012 Sales:
The following is a set of data from a sample of n = 11 items:a. Construct a scatter plot.b. Is there a relationship between X and Y? Explain.
The data stored in Drink represents the amount of soft drink in a sample of 50 2-liter bottles.a. Construct a histogram and a percentage polygon.b. Construct a cumulative percentage polygon.c. On the basis of the results in (a) and (b), does the amount of soft drink filled in the bottles
The file Bulbs contains the life (in hours) of a sample of 40 20-watt compact fluorescent light bulbs produced by Manufacturer A and a sample of 40 20-watt compact fluorescent light bulbs produced by Manufacturer B.Use the following class interval widths for each distribution:Manufacturer A: 6,500
also produces electric insulators. If the insulators break when in use, a short circuit is likely to occur. To test the strength of the insulators, destructive testing in high-powered labs is carried out to determine how much force is required to break the insulators. Force is measured by observing
The manufacturing company in Problem
inches wide?
and
inches. The widths of the troughs, in inches, collected from a sample of 49 troughs, are stored in Trough .a. Construct a percentage histogram and a percentage polygon.b. Plot a cumulative percentage polygon.c. What can you conclude about the number of troughs that will meet the company’s
inches and
A manufacturing company produces steel housings for electrical equipment. The main component part of the housing is a steel trough that is made out of a 14-gauge steel coil. It is produced using a 250-ton progressive punch press with a wipe-down operation that puts two 90-degree forms in the flat
inch shorter than the specified length.a. Construct a percentage histogram.b. Is the steel mill doing a good job meeting the requirements set by the automobile company? Explain.
inch of the length specified by the automobile company. The data are collected from a sample of 100 steel parts and stored in Steel . The measurement reported is the difference in inches between the actual length of the steel part, as measured by a laser measurement device, and the specified length
One operation of a mill is to cut pieces of steel into parts that will later be used as the frame for front seats in an automobile. The steel is cut with a diamond saw and requires the resulting parts to be within {
How do the average credit scores of people living in various cities differ? The file Credit Scores contains an ordered array of the average credit scores of 143 American cities. (Data extracted from usat.ly/17a1fA6.)a. Construct a percentage histogram.b. Construct a cumulative percentage polygon.c.
How much time do Americans living in or near cities spend waiting in traffic, and how much does waiting in traffic cost them per year? The data in the file Congestion include this cost for 31 cities. (Source: Data extracted from “The High Cost of Congestion,” Time, October 17, 2011, p. 18.) For
The following histogram and cumulative percentage polygon visualize the data about the property taxes per capita($) for the 50 states and the District of Columbia, stored in Property Taxes .
As player salaries have increased, the cost of attending baseball games has increased dramatically. The following histogram and cumulative percentage polygon visualizes the total cost(in $) for four tickets, two beers, four soft drinks, four hot dogs, two game programs, two baseball caps, and
The file Utility contains the following data about the cost of electricity during July 2013 for a random sample of 50 onebedroom apartments in a large city:
The file Caffeine contains the caffeine content (in milligrams per ounce) for a sample of 26 energy drinks:Source: Data extracted from “The Buzz on Energy-Drink Caffeine,”Consumer Reports, December 2012.a. Construct an ordered array.b. Construct a stem-and-leaf display
The file BBCost2012 contains the total cost (in $)for four tickets, two beers, four soft drinks, four hot dogs, two game programs, two baseball caps, and parking for one vehicle at each of the 30 Major League Baseball parks during the 2012 season.Source: Data extracted from
The following is a stem-and-leaf display representing the amount of gasoline purchased, in gallons (with leaves in tenths of gallons), for a sample of 25 cars that use a particular service station on the New Jersey Turnpike:a. Construct an ordered array.b. Which of these two displays seems to
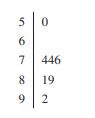
Construct an ordered array, given the following stem-andleaf display from a sample of n = 7 midterm exam scores in information systems: 5 0 6 7 84 446 8 19 9 2
Construct a stem-and-leaf display, given the following data from a sample of midterm exam scores in finance:54 69 98 93 53 74
A research was conducted to find if dogs resemble their owners. The finding of the research was that people tend to select dogs that in some way resemble them and the resemblance increases with the duration of ownership. Assume that this finding is specific to a particular breed of dogs and that
A research report states that an adolescent's overall health impacts their physical and psychological well being. The report looks at the direct relationship between nutritional intake and academic achievement. Milk intake was looked at specifically, as it is rich in calcium and contributes to bone
A study has been conducted on the prevalence of depression with respect to demographic features such as age, race, and gender. The survey was administered to 155 patients and it was found that women are more likely to be depressed compared to men, as shown in the table below.a. Which type of graph
Visier’s Survey of Employers explores how North American organizations are solving the challenges of delivering workforce analytics. Employers were asked what would help them be successful with human resources metrics and reports. The responses were as follows (stored in Needs ):a. Construct a
The following table indicates the percentage of residential electricity consumption in the United States, in a recent year organized by type of usea. Construct a bar chart, a pie chart, and a Pareto chart.b. Which graphical method do you think is best for portraying these data?c. What conclusions
The Edmunds.com NHTSA Complaints Activity Report contains consumer vehicle complaint submissions by automaker, brand, and category (data extracted from edmu.in/Ybmpuz.)The following tables, stored in Automaker1 and Automaker2 , represent complaints received by automaker and complaints received by
The following data has been recorded of the consumer complaints in a hotel:a. Construct a Pareto chart.b. What were the top and bottom 50% complaints received for?c. Based on results of a andb, what would you advise the hotel management to prioritize?
What do college students do with their time? A survey of 3,000 traditional-age students was taken, with the results as follows:a. Construct a bar chart, a pie chart, and a Pareto chart.b. Which graphical method do you think is best for portraying these data?c. What conclusions can you reach
An online survey commissioned by Vizu, a Nielsen company, of digital marketing and media professionals on current attitudes and practices regarding paid social media advertising was conducted by Digiday in fall 2012. Advertisers were asked to indicate the primary purpose of their paid social media
The file Drink contains the following data for the amount of soft drink (in liters) in a sample of 50 2-liter bottles:a. Construct a cumulative percentage distribution.b. On the basis of the results of (a), does the amount of soft drink filled in the bottles concentrate around specific values?
The file Bulbs contains the life (in hours) of a sample of 40 20-watt compact fluorescent light bulbs produced by Manufacturer A and a sample of 40 20-watt compact fluorescent light bulbs produced by Manufacturer B.a. Construct a frequency distribution and a percentage distribution for each
also produces electric insulators. If the insulators break when in use, a short circuit is likely to occur. To test the strength of the insulators, destructive testing in high-powered labs is carried out to determine how much force is required to break the insulators. Force is measured by observing
The manufacturing company in Problem
inches wide?
inches and 8.61. inches. The widths of the troughs, in inches, collected from a sample of 49 troughs and stored in Trough , are:a. Construct a frequency distribution and a percentage distribution.b. Construct a cumulative percentage distribution.c. What can you conclude about the number of troughs
A manufacturing company produces steel housings for electrical equipment. The main component part of the housing is a steel trough that is made out of a 14-gauge steel coil. It is produced using a 250-ton progressive punch press with a wipe-down operation that puts two 90-degree forms in the flat
inch shorter than the specified length.a. Construct a frequency distribution and a percentage distribution.b. Construct a cumulative percentage distribution.c. Is the steel mill doing a good job meeting the requirements set by the automobile company? Explain.
One operation of a mill is to cut pieces of steel into parts that will later be used as the frame for front seats in an automobile. The steel is cut with a diamond saw and requires the resulting parts to be within {0.005 inch of the length specified by the automobile company. Data are collected
How do the average credit scores of people living in different American cities differ? The data in Credit Scores is an ordered array of the average credit scores of 143 American cities. (Data extracted from usat.ly/109hZAR.)a. Construct a frequency distribution and a percentage distribution.b.
How much time do commuters living in or near cities spend waiting in traffic, and how much does this waiting cost them per year? The file Congestion contains the time spent waiting in traffic and the yearly cost associated with that waiting for commuters in 31 U.S. cities. (Source: Data extracted
The file Utility contains the following data about the cost of electricity (in $) during July 2013 for a random sample of 50 one-bedroom apartments in a large city.a. Construct a frequency distribution and a percentage distribution that have class intervals with the upper class boundaries $99,
The file BBCost2012 contains the total cost ($) for four tickets, two beers, four soft drinks, four hot dogs, two game programs, two baseball caps, and parking for one vehicle at each of the 30 Major League Baseball parks during the 2012 season.These costs werea. Organize these costs as an ordered
million.a. If these values are grouped into six class intervals, indicate the class boundaries.b. What class interval width did you choose?c. What are the six class midpoints?
million to
Data were collected on the Facebook website about the most “liked” fast food brands. The data values (the number of“likes” for each fast food brand) for the brands named ranged from
In late 2011 and early 2012, the Universal Health Care Foundation of Connecticut surveyed small business owners across the state that employed 50 or fewer employees. The purpose of the study was to gain insight on the current small business health-care environment. Small business owners were asked
Construct an ordered array for 30 students’ GPA:Can you draw any meaningful conclusions? Why or why not?
Construct an ordered array, given the following data from a sample of exam scores in Mathematics:88 78 78 73 91 78 85
Do social recommendations increase ad effectiveness? A study of online video viewers compared viewers who arrived at an advertising video for a particular brand by following a social media recommendation link to viewers who arrived at the same video by web browsing. Data were collected on whether
Each day at a large hospital, hundreds of laboratory tests are performed. The rate of “nonconformances,” tests that were done improperly (and therefore need to be redone), has seemed to be steady, at about 4%. In an effort to get to the root cause of the nonconformances, the director of the lab
A survey of 1,085 adults asked “Do you enjoy shopping for clothing for yourself?” The results indicated that 51% of the females enjoyed shopping for clothing for themselves as compared to 44% of the males. (Data extracted from “Split Decision on Clothes Shopping,” USA Today, January 28,
Visier’s Survey of Employers explores how North American organizations are solving the challenges of delivering workforce analytics. Employers were asked what would help them be successful with human resources metrics and reports. The responses (stored in Needs ) were as follows:a. Compute the
The following table represents world oil production in millions of barrels a day in the third quarter of 2011:a. Compute the percentage of values in each category.b. What conclusions can you reach concerning the production of oil in the third quarter of 2011?
The 2013 Mortimer Spinks and Computer Weekly Technology Survey reflect the views of technology and digital experts across the United Kingdom (bit.ly/WS4jg3). Respondents were asked, “What is the most important factor influencing the success of a tech start-up?” Assume the following results:a.
The Edmunds.com NHTSA Complaints Activity Report contains consumer vehicle complaint submissions by automaker, brand, and category (data extracted from edmu.in/Ybmpuz). The following tables, stored in Automaker1 and Automaker2 , represent complaints received by automaker and complaints received by
The following table, stored in Smartphone Sales , represents the annual percentage of smartphones sold in 2011, 2012, and 2013 (projected).a. What conclusions can you reach about the market for smartphones in 2011, 2012, and 2013?b. What differences are there in the market for smartphones in 2011,
The following data represent the responses to two questions asked in a survey of 40 college students majoring in business:What is your gender? 1M = male; F = female2 and What is your major? (A = Accounting; C = Computer Information Systems; M = Marketing):a. Tally the data into a contingency table
Showing 4300 - 4400
of 7675
First
37
38
39
40
41
42
43
44
45
46
47
48
49
50
51
Last
Step by Step Answers