New Semester
Started
Get
50% OFF
Study Help!
--h --m --s
Claim Now
Question Answers
Textbooks
Find textbooks, questions and answers
Oops, something went wrong!
Change your search query and then try again
S
Books
FREE
Study Help
Expert Questions
Accounting
General Management
Mathematics
Finance
Organizational Behaviour
Law
Physics
Operating System
Management Leadership
Sociology
Programming
Marketing
Database
Computer Network
Economics
Textbooks Solutions
Accounting
Managerial Accounting
Management Leadership
Cost Accounting
Statistics
Business Law
Corporate Finance
Finance
Economics
Auditing
Tutors
Online Tutors
Find a Tutor
Hire a Tutor
Become a Tutor
AI Tutor
AI Study Planner
NEW
Sell Books
Search
Search
Sign In
Register
study help
business
business statistics communicating
Business Statistics 10th Global Edition David Groebner, Patrick Shannon, Phillip Fry - Solutions
The following data are the population of ages of students who have recently purchased a sports video game:16 15 17 15 15 15 14 9 16 15 13 10 8 18 20 17 17 17 18 23 7 15 20 10 14 14 12 12 24 21a. Compute the population variance.b. Compute the population standard deviation.
The following data reflect the number of times a population of business executives flew on business during the previous month:4 6 9 4 5 7a. Compute the range for these data.b. Compute the variance and standard deviation.c. Assuming that these data represent a sample rather than a population,
Google is noted for its generous employee benefits.The following data reflect the number of vacation days that a sample of employees at Google have left to take before the end of the year:3 0 2 0 1 3 5 2 5 1 3 0 0 1 3 3 4 3 1 8 4 2 4 0a. Compute the range for these sample data.b. Compute the
In order to practice law in Nebraska, individuals are required to pass the Nebraska bar exam. The exam is challenging, and most attorneys who attempt to take the exam spend a substantial amount of time studying.The file Nebraska contains data on the number of hours spent studying for a sample of 50
Suppose a random sample of 137 households in Detroit was taken as part of a study on annual household spending for food at home. The sample data are contained in the file Detroit Eats.a. For the sample data, compute the mean and the median and construct a box and whisker plot.b. Are the data skewed
A proposal in a South Carolina county calls for all homeowners over the age of 65 with incomes at or below the 20th percentile to get a reduction in property taxes. A random sample of 50 people over 65 was selected, and the household incomes (as reported on the most current federal tax return)were
In an effort to track housing prices, the National Association of Realtors developed the Pending Home Sales Index (PHSI), a leading indicator for the housing market. An index of 100 is equal to the average level of contract activity during 2001, the first year to be analyzed. The file titled
Japolli Bakery tracks sales of its different bread products on a daily basis. The data for 22 consecutive days at one of its retail outlets in Nashville are in a file called Japolli Bakery. Calculate the mean, mode, and median sales for each of the bread categories and write a short report that
Dynamic random-access memory (DRAM) chips are routed through fabrication machines in an order that is referred to as a recipe. The data file DRAM Chips contains a sample of processing times, measured in fractions of hours, at a particular machine center for one chip recipe.a. Compute the mean
Each year, Bloomberg Businessweek publishes information and rankings of master of business administration (MBA) programs. The data file MBA Analysis contains similar data on several variables for eight reputable MBA programs. The variables include pre– and post–MBA salary, percentage salary
One of the conditions for measuring health is having a healthy body weight. An ideal body weight range is based on the height, gender, and age of a person. A recent study on health selected two different women’s age groups, in the same height range. Their weights were recorded as follows:Weight
The following table exhibits base salary data obtained from a survey of over 170 benchmark positions, including finance positions. It reports the salaries of a sample of 25 human resource directors for mid-sized firms. Assume the data are in thousands of dollars.173.1 171.2 141.9 112.6 211.1 156.5
To obtain the average retail cost of a 55 HD flatscreen TV in 2015, a survey yielded the following data(in U.S. dollars):606.70 558.12 625.82 533.70 464.37 511.15 400.56 538.20 531.64 632.14 474.86 567.46 588.39 528.78 610.32 564.71 912.68 475.87 545.25 589.15a. Calculate the mean cost for these
Samara Hauser is planning to buy a new car and she hopes to save on her expenses in petrol. Thus, before her purchase, she studied the mileage (in km) a car can travel at full tank oil capacity (in liters). The data are documented as follows:Car Mileage (km) Oil Capacity (l)1 465 40 2 423 38 3 360
Toys “R” Us, Inc., is the leading store for children’s toys and other play material. The company’s financial officer is determining the previous month’s sales revenues. The following data are a selection of 30 outlets’ sales revenue (in $ thousands) record:25 46 33 35 18 27 37 40 28 38
A librarian for Monfast University is checking the number of books borrowed by university students. He recorded the daily number of books borrowed by students during the past 30 days. The data are shown as follows:20 8 37 25 10 16 5 43 39 31 30 41 19 36 27 14 11 33 42 7 15 29 34 17 30 32 21 12 35
The La Costa Corporation operates five manufacturing plants in South America. The company tracks the medical costs that are directly attributed to accidents that occur at the plants each year. The following data show the medical costs (in U.S. dollars) at each plant for the most recent year along
Vistaprint is a digital printing company that prints items like business cards, calendars, and posters. It owns a certain number of printing machines. To ensure the machines operate properly, the factory supervisor conducts a procedural check every month. One item on her checklist is the machine
A food manufacturer recently found that there is a huge variation in the weight of chickens supplied by a local farm. To justify their suspicion, the manufacturer randomly selects 20 chickens and notes the weight of each (in kg) as follows:0.95 1.09 0.88 1.1 0.9 1 0.93 1.13 1.09 1.05 1.1 0.99 1.03
A professor wishes to develop a numerical method for giving grades. He intends to base the grade on homework, two midterms, a project, and a final examination. He wishes the final exam to have the largest influence on the grade. He wants the project to have 10%, each midterm to have 20%, and the
Consider the following scores for a statistics test that has been selected from students who attend Bright University:65 82 73 91 95 86 78 69 80 88 55 46 58 67 66 73 81 48 59 70a. Determine the median scores for the statistics test.b. Determine the 25th and 75th percentiles for the statistics test
Examine the following data:23 65 45 19 35 28 39 100 50 26 25 27 24 17 12 106 23 19 39 70 20 18 44 31a. Compute the quartiles.b. Calculate the 90th percentile.c. Develop a box and whisker plot.d. Calculate the 20th and the 30th percentiles.
A random sample of the miles driven by 20 rental car customers is shown as follows:90 85 100 150 125 75 50 100 75 60 35 90 100 125 75 85 50 100 50 80 Develop a box and whisker plot for the sample data.
The ages of 15 employees selected from a company are as follows:53 32 61 27 39 44 45 57 25 28 33 35 36 33 41 Calculate the mean, median, first quartile, and third quartiles for the sample employees’ ages.
A European cereal maker recently sampled 20 of its medium-size oat cereal packages to determine the weights of the cereal in each package. These sample data, measured in ounces, are as follows:14.7 16.3 14.3 14.2 18.7 13.2 13.1 14.4 16.2 12.8 13.6 17.1 14.4 11.5 15.5 15.9 13.8 14.2 15.1 13.5
The following data reflect the number of defects produced on an assembly line at the Dearfield Electronics Company for a period of 8 days:3 0 2 0 1 3 5 2 5 1 3 0 0 1 3 3 4 3 1 8 4 2 4 0a. Compute the mean number of defects for this population of days.b. Compute the median number of defects produced
A random sample of 15 articles in Fortune revealed the following word counts per article:5,176 6,005 5,052 5,310 4,188 4,132 5,736 5,381 4,983 4,423 5,002 4,573 4,209 5,611 4,568 Compute the mean, median, first quartile, and third quartile for these sample data.
The file titled Diesel$ contains the average nationwide diesel price on the last Friday of the month for the years 2013–2015.a. Construct a histogram with 11 classes.b. What are the possible reasons why one of the classes has a frequency count of zero?
Elliel’s Department Store tracks its inventory on a monthly basis. Monthly data for 2008 through 2012 are in the file called Elliels.a. Construct a line chart showing the monthly inventory over the five years. Discuss what this graph implies about inventory.b. Sum the monthly inventory figures
The file Home-Prices contains information about single-family housing prices in 100 metropolitan areas in the United States.a. Construct a frequency distribution of median single-family home prices. Use the 2k Ú n guideline to determine the appropriate number of classes.b. Construct a cumulative
The data in the file titled Digital provide the brand of digital devices owned by a sample of consumers.Produce a pie chart that represents the market shares obtained from the referenced sample. Indicate the market shares and the identity of those manufacturers in the pie chart.
The file titled Diesel$ contains the average on-highway diesel prices for the last Friday of the month in the years 2013–2015. Develop a line chart that shows the trend in diesel prices, and write a short statement that describes the price trend.
DLT is an authorized dealer for selling desktops, laptops, tablets, and other computer accessories for certain computer technology companies. The following table shows the sales of DLT’s three best-selling products in the past six months:January February March April May June Desktops 77 45 23 19
A computer software company has been looking at the amount of time customers spend on hold after their call is answered by the central switchboard. The company would like to have at most 2% of the callers wait two minutes or more. The company’s calling service has provided the following data
Catherine just graduated and received a Bachelor’s Degree. She wants to determine whether she needs to continue pursuing a Master’s Degree or start working.She did a study on the monthly income earned by a person based on the number of years they spent studying after high school. The data
Dave is doing a study on recycling. He visited the civic amenity site (CA site) and household waste recycling center (HWRC) where the public can dispose of household waste to collect his data.Following are the amount of waste (in tons) on three different items most collected by the two facilities
A museum is planning to adjust the price of its entry tickets. The management recorded a group of visitors’ages for a specific day. The sample collected by the museum is as follows:34 24 14 23 56 32 54 65 47 23 54 12 35 46 7 35 24 34 34 63 25 35 14 13 35 46 64 24 35 42 24 35 63 21 33 19 53 10 9
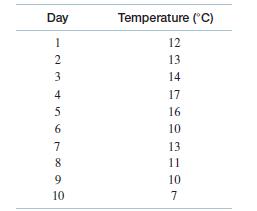
Barbara is going to Tokyo for a business trip that will last for a period of 10 days. To make sure she brings enough clothes for the trip, she checks the weather report to estimate the general weather pattern during her stay in Tokyo. The following are the estimated daily average temperatures she
As it has become more popular to stream movies over the Internet at home from such sources as Hulu and Netflix, ticket sales at movie theaters have been affected.The following data reflect annual ticket sales in billions at U.S. movie theaters between 1995 and 2015. Develop an appropriate chart to
State the differences between a line chart and a scatter plot.
What are the characteristics of a data set that would lead you to construct a pie chart?
What are the characteristics of a data set that would lead you to construct a bar chart?
Discuss the advantages of constructing a relative frequency distribution as opposed to a frequency distribution.
The sub-prime mortgage crisis that hit the world economy also affected the real estate market. Both new and existing home sales were affected. A file titled EHSales contains the number of existing homes sold(in millions) from September 2007 to September 2008.a. Construct a line plot for these
Federal flood insurance underwritten by the federal government was initiated in 1968. This federal flood insurance coverage has, according to USA Today(“How you pay for people to build in flood zones,”Sep. 21, 2005), more than tripled between 1990 and 2004. A file titled Flood contains the
The data in the file called Gasoline Prices reflect the average price of regular unleaded gasoline in the state of California for 36 consecutive years. The first price column is the actual average price of gasoline during each of those years. Construct an appropriate chart showing the actual
Japolli Bakery tracks sales of its different bread products on a daily basis. The data are located in a data file called Japolli Bakery. Develop a line chart that displays these data. Discuss what, if any, conclusions you might be able to reach from the line chart.
As an analyst for one of the major airlines, you have been asked to analyze the relationship between passenger capacity and fuel consumption per hour.Data for 17 commonly flown planes are presented in the file called Airplanes. Develop the appropriate graph to illustrate the relationship between
Wilson Green started a lawn service business in 1997 with 15 customers. By 2015 his customer list had grown to 6,530 customers across three cities. The file WilsonGreen contains data showing the number of customers for each year between 1997 and 2015.Develop a line chart that shows the customer
Having a Major League Baseball team in a city is generally considered to provide an economic boost to the community. The data file MLB Attendance-2015 contains data for both home and road game attendance for all 30 MLB teams for 2015. Of interest is the relationship between average home attendance
On July 31, 2015, usatoday.com reported on big oil profits. The file BIGOIL contains the quarterly combined net incomes of the oil companies that are part of the S&P 500 Index for 2006 through the first half of 2015. The article discussed that after years of record profits, the oil companies were
At a local clinic, a doctor has been receiving complaints from the nurse that the clinic needs more staff members due to the increasing number of patients.Before the doctor makes a decision, he checks whether the number of staff members depends on the number of patients visiting the clinic. The
The following data show worldwide computer/video game sales:Year Sales (billions)2000 $48.2 2001 $45.4 2002 $48.3 2003 $41.9 2004 $54.6 2005 $44.3 2006 $48.4 2007 $62.9 2008 $77.2 2009 $64.5 2010 $65.9 2011 $66.2 2012 $63.0 2013 $76.0 Construct a line chart showing these computer/video game sales
A mechanic is determining the weight of a car affecting gas mileage. He measures and records 10 various cars’ weight (in pounds) and their miles per gallon (MPG) in the following table:Weight MPG 3,565 20 3,985 18 3,180 19 3,340 21 3,100 21 3,175 22 2,580 27 3,175 22 2,655 26 3,300 20a. Construct
Azuria Inc. recorded its every half an hour stock prices during a day from 9:30 a.m. to 4:00 p.m., represented in the following data:Time 9:30 a.m. 10 a.m. 10:30 a.m. 11 a.m. 11:30 a.m. 12 noon 12:30 p.m.Price ($) 47.99 47.99 47.95 48.15 48.20 48.64 48.32 Time 1 p.m. 1:30 p.m. 2 p.m. 2:30 p.m. 3
The year-end net income (in millions) for a company for the years 2004–2015 are shown below:Year 2004 2005 2006 2007 2008 2009 Net Income 25.9 31.5 31.7 31.7 34.5 36.8 Year 2010 2011 2012 2013 2014 2015 Net Income 64 101.3 77 87.1 118.6 172.5 Develop a chart that effectively displays the income
The following data have been selected for two variables, y and x. Construct a scatter diagram for these two variables and indicate what type of relationship, if any, appears to be present.y x 100 23.5 250 17.8 70 28.6 130 19.3 190 15.9 250 19.1 40 35.3
You have the following sales data for the past 12 months. Develop a line graph for these data.Month Jan Feb Mar Apr May Jun Sales 200 230 210 300 320 290 Month Jul Aug Sep Oct Nov Dec Sales 300 360 400 410 390 450
The following data represent 11 observations of two quantitative variables:x = contact hours with client, y = profit generated from client.x y x y x y x y 45 2,345 54 3,811 34 -700 24 1,975 56 4,200 24 2,406 45 3,457 32 206 26 278 23 3,250 47 2,478a. Construct a scatter diagram of the data.
In your capacity as assistant to the administrator at Freedom Hospital, you have been asked to develop a graphical presentation that focuses on the insurance carried by the geriatric patients at the hospital. The data file Patients contains data for a sample of geriatric patients. In developing
Amazon.com has become one of the success stories of the Internet age. Its growth can be seen by examining its increasing sales volume (in $billions) and the net income/loss during Amazon’s operations. A file titled Amazon contains these data for its first 17 years (source: 2011 Amazon Annual
A health insurance company selected a random sample of hospitals from each of four categories of hospitals: university related, religious related, community owned, and privately owned. At issue is the hospital charges associated with outpatient gall bladder surgery. The data are in the file called
The manager for a credit union has selected a random sample of 300 of the credit union’s credit card customers. The data are in a file called Capital. The manager is interested in graphically displaying the percentage of card holders of each gender.a. Determine the appropriate type of graph to
Suppose that cars with high consumer satisfaction ratings have a tendency to stay on dealers’ lots a shorter period of time. As an example, suppose the Honda Ridgeline had stayed on dealers’ lots an average of 24 days. The file titled Honda contains 50 lengths of stay on dealers’ lots for
A survey conducted at a state university that asked students what brand of digital music device they owned yielded the following data:Corporation Apple Samsung LG Nokia HTC Percentage 74% 6.4% 3.9% 3.6% 2.6%a. Generate a bar chart to display these data.b. Generate a pie chart to display these
The following data represent the seat capacity for major airlines on an annual basis:Airline Seat Capacity (in Billions)Airline Capacity United Delta Northwest U.S. Airways ATA 145 130 92 54 21a. Construct a bar graph representing the seat capacity of the major airlines for the five airlines
A random sample of 30 customer records for a physician’s office showed the following times (in days)required to collect insurance payments:Number of Days to Collect Payment 34 55 36 39 36 32 35 30 47 31 60 66 48 43 33 24 37 38 65 35 22 45 33 29 41 38 35 28 56 56a. Construct a stem and leaf
A fast-food restaurant monitors its drive-thru service times electronically to ensure that its speed of service is meeting the company’s goals. A sample of 28 drivethru times was recently taken and is shown here:Speed of Service (Time in Seconds)83 138 145 147 130 79 156 156 90 85 68 93 178 76 73
The 2014 Annual Report of the Procter & Gamble Company (see www.pginvestor.com) reported the following percentages for its five global business segments:Global Segment Percent of Total Sales Beauty 24%Grooming 10%Health Care 9%Fabric Care and Home Care 32%Baby Care and Family Care 25%a. Construct a
WTS Travels is preparing its summer packages, and the sales manager, Raman, is trying to determine packages that are more profitable for the year. He refers to the last year’s sales records, which show the profits earned by their two summer packages over three months.March April May Package A
Aunty Soo’s fish ball noodle stall at a local food court is a popular place for college students to meet. Soo noted that the business did not do well in the previous week. She refers to the sales record and lists the net profits earned last week as follows:Day Sunday Monday Tuesday Wednesday
The first few years after the turn of the century saw a rapid increase in housing values, followed by a rapid decline due in part to the sub-prime crisis. The following table indicates the increase in the number of homes valued at more than one million dollars before 2005:Year Number of $1 Million
The number of British emigrants (in thousands) to five select destinations are shown in the following table:Destination Australia Spain USA New Zealand France British emigration amount 52 34 26 21 28a. Construct a bar chart to display the British emigrations.b. Determine the proportion for the
The following shows the amount of sugar (in million tons) exported by White Santy for the past five months.Months March April May June July Exported sugar amount(million tons)0.69 0.58 0.55 0.62 0.65a. Construct a bar chart for the exported sugar amount.b. Construct a pie chart for the exported
A survey was conducted using a sample of 100 youths to determine what their most favorable leisure activity is. The following are the results (in percentage)obtained from the youths:Leisure Activity Participation Percentage Bike riding 12%Watching TV/videos 51%Electronic/computer games 32%Art and
An online platform, Worldometers, features live world statistics on population, economics, and other categories. The following data is the population of five major European countries in 2006 and 2016:European Country Population (in Millions)Year 2006 Year 2016 Germany 81.8 82.3 Turkey 62.3 73.4
An annual report for Murphy Oil Corporation reports the following refinery yields, in barrels per day, by product category for the United States and the United Kingdom.United States Product Category Refinery Yields—barrels per day Gasoline 61,128 Kerosene 11,068 Diesel and Home Heating Oils
Given the following sales data for product type and sales region, construct at least two different bar charts that display the data effectively:Region Product Type East West North South XJ-6 Model 200 300 50 170 X-15-Y Model 100 200 20 100 Craftsman 80 400 60 200 Generic 100 150 40 50
A university has the following number of students at each grade level:Freshman 3,450 Sophomore 3,190 Junior 2,780 Senior 1,980 Graduate 750a. Construct a bar chart that effectively displays these data.b. Construct a pie chart to display these data.c. Referring to the graphs constructed in parts a
Given the following data on the age of a group of people, construct a stem and leaf diagram:1 2 3 3 4 5 10 10 10 17 19 26 26 27 28 30 31 33 33 33 36 43 48 49 49 49 50 51 53 58
The file Danish Coffee contains data on individual coffee consumption (in kg) for 144 randomly selected Danish coffee drinkers.a. Construct a histogram of the coffee consumption data. Briefly comment on what the histogram reveals concerning the data.b. Develop a relative frequency distribution and
The manager of AJ’s Fitness Center, a full-service health exercise club, recently conducted a survey of 1,214 members. The objective of the survey was to determine the satisfaction level of his club’s customers.In addition, the survey asked for several demographic factors such as age and
The Orlando International Airport is busy throughout the year. Among the variety of data collected by the Greater Orlando Aviation Authority is the number of passengers by airline. The file Orlando Airport contains passenger data for December 2011. Suppose the airport manager is interested in
The California Golf Association recently conducted a survey of its members. Among other questions, the members were asked to indicate the number of 18-hole rounds that they played last year. Data for a sample of 294 members are provided in the data file called Golf Survey.a. Using the 2k Ú n
The Franklin Tire Company is interested in demonstrating the durability of its steel-belted radial tires. To do this, the managers have decided to put four tires on 100 different sport utility vehicles and drive them throughout Alaska. The data collected indicate the number of miles (rounded to the
One effect of the great recession was to lower the interest rate on fixed-rate mortgages. A sample of 30-year fixed-rate mortgage rates taken from financial institutions in the Pacific Northwest resulted in the following:3.79 4.03 3.92 3.87 3.86 3.93 3.87 3.69 3.99 3.88 3.91 3.81 3.85 3.81 3.65
A café recently conducted a survey on its coffee selling by customers’ age. The owner recorded the first 30 customers who visited his café and had chosen coffee as their drink. The customers’ respective ages were recorded in a sample data set as follows:23 45 28 37 48 51 18 23 13 52 41 21 29
Aria is an assistant HR manager. She is helping the manager shortlist candidates by their required salary for the post of management trainee. The following are the required salary (in $) from 50 candidates:3,000 2,500 3,250 2,950 2,900 4,000 3,100 2,700 2,850 2,600 3,700 3,250 2,750 2,480 2,300
A St. Louis–based shipping company recently selected a random sample of 49 airplane weight slips for crates shipped from an automobile parts supplier. The weights, measured in pounds, for the sampled crates are as follows:89 83 97 101 86 89 86 91 84 89 87 93 86 90 86 92 92 88 88 92 86 93 80 93 77
A developer is launching their new developments for two types of housing. During the launching, the sales representatives will show and explain the show units for both types of housing to the customers. To provide better services, the management asked the sales representatives to record their
The owner of a toy shop conducts a survey of goods sold in the past two weeks. He sorts the toys into three categories—soft toys, educational toys, and physical activity toys with their respective sales per week. A total of 85 toys were sold in the past two weeks and showed an equal total sale of
PLUSLine is a 24-hour PLUS toll free customer care line. The highway users can receive the latest traffic updates, lodge a feed, or request for PLUSRonda assistance on the PLUS expressways. The following are the average duration per call (in minutes) received in a day, for the previous two months,
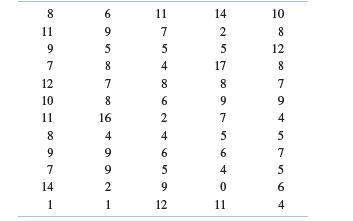
Using the data from Exercise 2-7:a. Construct a grouped data relative frequency distribution of the data. Use the 2k Ú n guideline to determine the number of classes.b. Construct a cumulative frequency distribution of the data.c. Construct a relative frequency histogram.d. Construct an ogive.
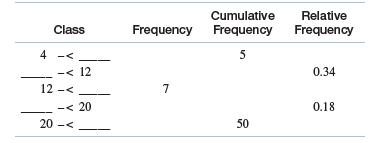
Complete the following equal-class-width frequency distribution with appropriate figures: Cumulative Class Frequency Frequency Relative Frequency 4- < 5 - < 12 0.34 12- < 7 - < 20 20- < 0.18 50
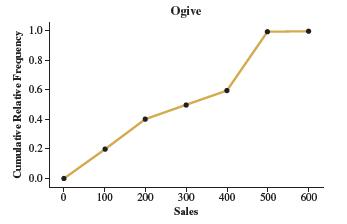
Produce the relative frequency distribution from a sample size of 50 that gave rise to the following ogive:2-5. You have the following data:a. Construct a frequency distribution for these data.Use the 2k Ú n guideline to determine the number of classes to use.b. Develop a relative frequency
With their individual tickets to attend an evening dinner, every guest has the chance to win the grand door prize.a. Which sampling method is the fairest to use to select the grand door price?b. Determine how the sampling method mentioned in part a is to be conducted.
A company with 400 employees is going to conduct a development training program for its staff. The training program has limited seats for only 15 employees. Suggest a most common and basic form of probability sampling to the company and briefly explain how to conduct it.
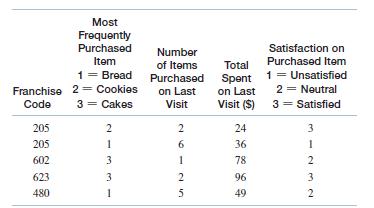
D’Bakery has its franchises at several states. Recently, the bakery did a customer survey on the satisfaction of items purchased by the customer in its franchises. The following are the information collected from one of the selected state.a. Justify whether the collected data is time-series data
In a business publication such as The Wall Street Journal or Bloomberg Businessweek, find a graph or chart representing cross-sectional data. Discuss how the data were gathered and the purpose of the graph or chart.
In a business publication such as The Wall Street Journal or Bloomberg Businessweek, find a graph or chart representing time-series data. Discuss how the data were gathered and the purpose of the graph or chart.
Showing 3700 - 3800
of 6020
First
31
32
33
34
35
36
37
38
39
40
41
42
43
44
45
Last
Step by Step Answers