New Semester
Started
Get
50% OFF
Study Help!
--h --m --s
Claim Now
Question Answers
Textbooks
Find textbooks, questions and answers
Oops, something went wrong!
Change your search query and then try again
S
Books
FREE
Study Help
Expert Questions
Accounting
General Management
Mathematics
Finance
Organizational Behaviour
Law
Physics
Operating System
Management Leadership
Sociology
Programming
Marketing
Database
Computer Network
Economics
Textbooks Solutions
Accounting
Managerial Accounting
Management Leadership
Cost Accounting
Statistics
Business Law
Corporate Finance
Finance
Economics
Auditing
Tutors
Online Tutors
Find a Tutor
Hire a Tutor
Become a Tutor
AI Tutor
AI Study Planner
NEW
Sell Books
Search
Search
Sign In
Register
study help
business
business statistics communicating
Business Statistics Communicating With Numbers 1st Edition Kelly Jaggia - Solutions
The following table shows the total revenue (in billions of $)for Walmart Stores, Inc. and Target Corp. for the years 2008-2010. R-96a. Calculate the average growth rate for each firm.b. Which firm had the higher growth rate over the 2008-2010 period? Year 2008 2009 2010 Walmart 379.8 404.3 408.2
Home Depot and Lowe's are the two largest home improvement retailers in the U.S. The following table shows the total revenue (in billions) for each retailer for the years 2008–2010. R-96a. Calculate the growth rate for 2008–2009 and 2009–2010 for each retailer.b. Calculate the average growth
Suppose at the beginning of 2005 you decide to invest$20,000 in Driehaus' Emerging Markets Growth mutual fund. The following table shows the returns for the years 2005-2009. R-96a. Calculate and interpret the arithmetic mean return.b. Calculate and interpret the geometric mean return.c. How much
Suppose at the beginning of 2006 you decide to invest$1,000 in Vanguard's European Stock Index mutual fund. The following table shows the returns for the years 2006-2009. R-96a. Calculate and interpret the arithmetic mean return.b. Calculate and interpret the geometric mean return.c. How much money
Calculate the average growth rate from the following growth rates. R-96 2.5% 3.6% 1.8% 2.2% 5.2%
Consider the following observations of a time series: R-96a. Calculate the growth rates for Year 1-Year 2, Year 2–Year 3, and Year 3–Year 4.b. Calculate the average growth rate. Year 1 Year 2 Year 3 1,200 1,280 Year 3 Year 4 1,380 1,520
Consider the following observations of a series: R-96a. Calculate the growth rates for Year 1-Year 2, Year 2-Year 3, and Year 3-Year 4.b. Calculate the average growth rate. Year 1 Year 2 Year 3 Year 3 Year 4 90 110 150 160
Calculate the geometric mean return of the following data set: R-96 -3% 2% -5% 2.7% 3.1%
Calculate the average growth rate return of the following data set: R-96 4% 8% -5% 6%
A price-earnings ratio or P/E ratio is calculated as a firm's share price compared to the income or profit earned by the firm per share. Generally, a high P/E ratio suggests that investors are expecting higher earnings growth in the future compared to companies with a lower P/E ratio. The
Scores on the final in a statistics class are as follows.a. Calculate and interpret the 25th, 50th, and 75th percentiles.b. Construct a box plot. Are there any outliers? Is the distribution symmetric? If not, comment on its skewness. R-96 75 25 75 62 80 85 80 99 90 60 86 92 40 74 72 65 87 70 85 70
Consider the following data set:a. Calculate and interpret the 25th, 50th, and 75th percentiles.b. Construct a box plot. Are there any outliers? R-96 0.04 0.10 -0.05 -0.02 0.08 0.15 -0.09
Consider the following data set: R-96a. Calculate and interpret the 25th, 50th, and 75th percentiles.b. Construct a box plot. Are there any outliers? 12 9 27 15 58 35 21 32 22 22
Calculate the 20th, 40th, and 70th percentiles for the following data set: R-96 -300 -257 -325 -234 -297 -362 -255
Calculate the 20th, 50th, and 80th percentiles for the following data set: R-96 120 215 187 343 268 196 312
One important statistic in baseball is a pitcher's earned run average, or ERA. This number represents the average number of earned runs given up by the pitcher per nine innings. The following table lists a portion of the ERAs for pitchers playing for the New York Yankees and the Baltimore Orioles
The Massachusetts Department of Public Health reported the following prevalent causes of death in the state. R-96Which measure of central location is most useful in making staffing decisions at Massachusetts' hospitals?Explain. Cause of Death Deaths per Cause of Day Deaths per Death Day Cancer 36
The following table shows Fortune 500's rankings of America's 10 largest corporations for 2010. Next to each corporation is its market capitalization (in billions of dollars as of March 26, 2010) and its total return to investors for the year 2009. These data, labeled Largest Corporations, are also
The following table shows the 10 highest-paid chief executive officers of the last decade. R-96a. Calculate the mean compensation for the 10 highestpaid chief executive officers.b. Does the mean accurately reflect the center of the data?Explain. Name Firm Lawrence Ellison Oracle Compensation (in
The following table shows the retail price for a box of 12 Titleist Pro golf balls from around the world; the data, labeled Titleist, can also be found on the text website. R-96a. In what city are golf balls most expensive? Least expensive?b. Calculate the mean price, the median price, and the
Given the following observations from a population, calculate the mean, the median, and the mode. R-96 20 20 15 25 25 20 10 15 25 20 15
Given the following observations from a population, calculate the mean, the median, and the mode. R-96 150 257 55 110 110 43 201 125 55
Given the following observations from a sample, calculate the mean, the median, and the mode. R-69 -4 0 -6 1 -3 -4
Given the following observations from a sample, calculate the mean, the median, and the mode. R-69 00 8 10 9 12 12
Seven people work at Acetech, a small technology firm in Seattle. Their salaries over the past year are listed in Table 3.2. Compute the mean salary for this firm and discuss whether it accurately indicates a typical value. R-69 TABLE 3.2 Salaries of Employees at Acetech Title Salary Administrative
The fo llow ing table lists the U.S. sales (in $ m illions) of prescription drugs used to treat seizure disorders.a. Construct a relative frequency distribution.b. For what percentage of sales did Lamictal account?c. Construct a pie chart. R-69 Drug Sales in 2006 Topamax $1,825.4 Lamictal 1,684.3
A survey conducted by CBS News asked 1,026 respondents:"What would you do with an unexpected tax refund?" The responses are summarized in the following table.a. Construct a bar chart for these data.b. How many people will spend the tax refund? R-69 Pay off debts 47% Put it in the bank 30% Spend it
A recent poll of 3,057 individuals asked: "What's the longest vacation you plan to take this summer?" The following relative frequency distribution summarizes the results.a. Construct a frequency distribution of these data. How many people are going to take a one-week vacation this summer?b.
Money magazine (January 2007) reported that an average of 77 million adults in the U.S. make financial resolutions at the beginning of a new year. Consider the following frequency distribution, which reports the top financial resolutions of 1, 026 Americans (Source: MONEY/ICR poll conducted
The Statistical Abstract o f the United States, 2010 provided the following frequency distribution of the number of people who live below the poverty level by region.a. Construct a relative frequency distribution. What percent of people who live below the poverty level live in the Midwest?b.
The one-year return (in %) for 24 mutual funds is as follows:a. Construct a frequency distribution using classes of —20 up to —10, —10 up to 0, etc.b. Construct the relative frequency, the cumulative frequency, and the relative cumulative frequency distributions.c. How many of the funds had
A survey conducted by CBS News asked parents about the professions they would want their children to pursue. The results are summarized in the following table.a. Construct a bar chart and a pie chart for these data.b. How many parents wanted their children to become athletes if the above results
Patrons at a local restaurant were asked to rate their recent experience at the restaurant with respect to its advertised atmosphere of upbeat, comfortable, and clean. Possible responses included Outstanding, Good, OK, and Please Get Help. The following table shows the responses of 28 patrons:a.
A 2003 survey by the Centers for Disease Control and Prevention concluded that smoking is forbidden in nearly 75% of U.S. households (Boston Globe, May 25, 2007). The survey gathered responses from at least 900 households in each state. When residents of Utah were asked whether or not smoking was
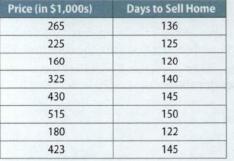
In an attempt to determine whether a relationship exists between the price of a home and the number of days it takes to sell the home, a real estate agent collects data on the recent sales of eight homes.Construct a scatterplot. What can the realtor conclude? R-69 Price (in $1,000s) 265 225 Days to
In order to diversify risk, investors are often encouraged to invest in assets whose returns have either a negative relationship or no relationship. The annual return data on two assets is shown below.Construct a scatterplot. For diversity purposes, would the investor be wise to include these
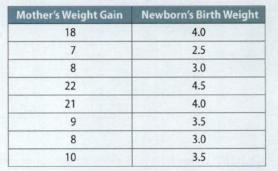
A recent study offers evidence that the more weight a woman gains during pregnancy, the higher the risk of having a high-birth-weight baby, defined as 8 pounds, 13 ounces, or 4 kilograms (The Wall Street Journal, August 5, 2010). Highbirth-weight babies are more likely to be obese in adulthood.The
A statistics instructor wants to examine whether a relationship exists between the hours a student spends studying for the final exam (Hours) and a student's grade on the final exam (Grade). She takes a sample of 8 students.Construct a scatterplot. What conclusions can you draw from the
Construct a scatterplot with the following data. Categorize the relationship between x and y . R-69 X 1 2 3 4 5 y 22 20 18 10 5 64 6 7 4 3 82
Construct a scatterplot with the following data. Does a linear relationship exist between x and y? R-69 10 4 6 3 7 3 2 6 6 4
Construct a scatterplot with the following data. Categorize the relationship between x and y. R-69 3 7 12 5 6 y 22 10 5 14 12
Spain was the winner of the 2010 World Cup, beating the Netherlands by a score of 1–0. The ages of the players from both team s were as follows: R-69Construct a stem-and-leaf diagram for each country.Comment on similarities and differences between the two data sets. R-69 Spain 29 25 23 30 32 21
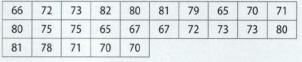
A police officer is concerned with excessive speeds on a portion o f Interstate 90 w ith a posted speed lim it o f 65 miles per hour. Using his radar gun, he records the following speeds for 25 cars and trucks:Construct a stem-and-leaf diagram. Are the officer's concerns warranted? R-69 66 72 73 82
Suppose the following high temperatures were recorded for major cities in the contiguous United States for a day in July.Construct and interpret a stem-and-leaf diagram. R-69 84 92 96 91 96 94 93 82 81 76 90 95 84 90 84 98 94 90 83 78 88 96 106 78 92 98 91 84 80 94 94 93 107 87 77 99 94 73 74 92
A sample of patients arriving at Overbrook Hospital's emergency room recorded the following body temperature readings over the weekend:Construct and interpret a stem-and-leaf diagram. R-69 100.4 99.6 101.5 99.8 102.1 101.2 102.3 101.2 102.2 102.4 101.6 101.5 99.7 102.0 101.0 102.5 100.5 101.3 101.2
Consider the following data set:Construct a stem-and-leaf diagram. Is the distribution symmetric? Explain. R-69 -64 -52 -73 -82-85-80 -79 -65-50-71 80 -85-75-65-77-87-72-83 -73-80
Consider the following data set:Construct a stem-and-leaf diagram. Is the distribution symmetric? Explain. R-69 5.4 4.6 3.5 2.8 2.6 5.5 5.5 2.3 3.2 4.2 4.0 3.0 3.6 4.5 4.7 4.2 3.3 3.2 4.2 3.4
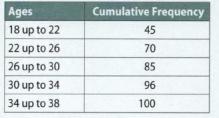
The manager of a nightclub near a local university recorded the ages of the last 100 guests in the following cumulative frequency distribution.a. Construct the corresponding frequency, relative frequency, and cumulative relative frequency distributions.b. How many of the guests were at least 26 but
The following relative frequency distribution summarizes the ages of women who had a child in the last year.a. Assume the relative frequency distribution is based on a sampling of 2,000 women. Construct the corresponding frequency distribution, cumulative frequency distribution, and cumulative
Fifty cities provided information on vacancy rates (in percent)in local apartments in the following frequency distribution.a. Construct the corresponding relative frequency distribution, cumulative frequency distribution, and cumulative relative frequency distribution.b. How many of the cities had
The following table lists a portion of the average math SAT scores for each state for the year 2009.The complete data set can be found on the text website and is labeled Math SAT 2009.a. Construct a frequency distribution using classes of 450 to 500, 501 to 550, etc. How many of the states had
AccuWeather.com listed the following high temperatures(in degrees Fahrenheit) for 33 European cities on July 21, 2010.a. Construct a frequency distribution using classes of 60 up to 70, 70 up to 80, etc.b. Construct the relative frequency, the cumulative frequency, and the relative cumulative
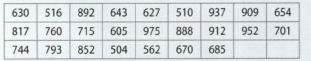
The numbers of texts sent by 25 13-year-olds over the past month were as follows:a. Construct a frequency distribution using classes of 500 up to 600,600 up to 700, etc.b. Construct the relative frequency distribution, the cumulative frequency distribution and the relative cumulative frequency
Kiplinger's (August 2007) lists the assets (in billions of $) for the 20 largest stock mutual funds (ranked by size) as follows:a. Construct a frequency distribution using classes of 40 up to 70, 70 up to 100, etc.b. Construct the relative frequency distribution, the cumulative frequency
Consider the following cumulative relative frequency distribution.a. Construct a relative frequency distribution. What percent of the observations are at least 250 but less than 300?b. Graph an ogive. R-69 Class Cumulative Relative Frequency 150 up to 200 0.10 200 up to 250 0.35 250 up to 300 0.70
Consider the following relative frequency distribution:a. Suppose this relative frequency distribution is based on a sample of 50 observations. Construct a frequency distribution. How many of the observations are at least — 10 but less thanO?b. Construct a cumulative frequency distribution. How
Consider the following cumulative frequency distribution:a. Construct a frequency distribution. How many observations are at least 35 but less than 45?b. Graph a frequency histogram.c. What percent of the observations are less than 45? R-69 Class Cumulative Frequency 15 up to 25 30 25 up to 35 50
Consider the following frequency distribution:a. Construct a relative frequency distribution. What percent of the observations are at least 1100 but less than 1200?b. Construct a cumulative frequency distribution and a cumulative relative frequency distribution. How many of the observations are
Consider the following frequency distribution:a. Construct a relative frequency distribution. Graph a relative frequency histogram.b. Construct a cumulative frequency distribution and a cumulative relative frequency distribution.c. What percent of the observations are at least 30 but less than 40?
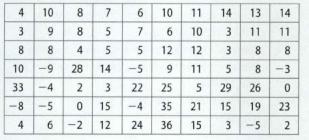
Consider the following data set:a. Construct a frequency distribution using classes of -1 0 up to 0,0 up to 10, etc. How many of the observations are at least 10 but less than 20?b. Construct a relative frequency distribution and a cumulative relative frequency distribution. What percent of the
Consider the following data set:a. Construct a frequency distribution using classes of 3 up to 5,5 up to 7, etc.b. Construct relative frequency, cumulative frequency, and cumulative relative frequency distributions.c. How many of the observations are at least 7 but less than 9? How many of the
Annual sales at a small pharmaceutical firm have been rather stagnant over the most recent five-year period, exhibiting only 1.2% growth over this time frame. A research analyst prepares the accompanying graph for inclusion in a sales report.Does this graph accurately reflect what has happened to
The accompanying figure plots the monthly stock price of Caterpillar, Inc., from July 2009 through March 2011. The stock has experienced tremendous growth over this time period, almost tripling in price. Does the figure reflect this growth? If not, why not? R-69 500 400 Stock 300 Price ($) 200 100
A 2010 poll conducted by NBC asked respondents who would win Super Bowl XLV in 2011. The responses by 20,825 people are summarized in the following table.a. How many responses were for "Others"?b. The Green Bay Packers won Super Bowl XLV, defeating the Pittsburgh Steelers by the score of 31-25.
A survey conducted by CBS News asked 829 respondents which of the following events will happen first. The responses are summarized in the following table:a. Construct a bar chart and a pie chart for these data.b. How many people think that a cure for cancer will be found first? R-69 Cure for cancer
The following table lists U.S. revenue (in $ billions) of the major car-rental companies.a. Construct a relative frequency distribution.b. Hertz accounted for what percentage of sales?c. Construct a pie chart for these data. R-69 Car-Rental Company Revenue in 2009 Enterprise $10.7 Hertz 4.7 Avis
What is the perfect summer trip? A National Geographic Kids survey (AAA Horizons, April 2007) asked this question to 316 children ages 8 to 14. Their responses are given in the following frequency distribution.a. Construct a relative frequency distribution. What percentage of the responses cited
A recent survey asked 5,324 individuals: "What's most im portant to you when choosing where to live?" The responses are shown in the following relative frequency distribution.a. Construct the corresponding frequency distribution.How many of the respondents chose "low crime" as the most important
Fifty pro-football rookies were rated on a scale of 1 to 5, based on performance at a training camp as well as on past performance. A ranking of 1 indicated a poor prospect whereas a ranking of 5 indicated an excellent prospect. The following frequency distribution was constructed.a. How many o f
AccuWeather.com reported the following weather delays at these major U.S. airline hubs for July 21, 2010:a. Construct a frequency and a relative frequency distribution that summarizes the delays at major U.S.hubs. W hat was the m ost com m on type o f delay? Explain.b. Construct a pie chart and a
A survey asked chief executives at leading U.S. firms the following question: "Where do you expect the U.S. economy to be 12 months from now?" A representative sample of their responses appears below:a. Construct a frequency and a relative frequency distribution that summarizes the responses to the
First-time patients at North Shore Family Practice are required to fill out a questionnaire that gives the doctor an overall idea of each patient's health. The first question is:"In general, what is the quality of your health?" The patient chooses Excellent, Good, Fair, or Poor. Over the past m
A local restaurant is committed to providing its patrons with the best dining experience possible. On a recent survey, the restaurant asked patrons to rate the quality of their entrees.The responses ranged from 1 to 5, where 1 indicated a disappointing entree and 5 indicated an exceptional
The fo llow ing table lists the U.S. sales (in $ m illions) of prescription drugs used to treat seizure disorders.a. Construct a relative frequency distribution.b. For what percentage of sales did Lamictal account?c. Construct a pie chart. R-69 Drug Sales in 2006 Topamax $1,825.4 Lamictal 1,684.3
A survey conducted by CBS News asked 1,026 respondents:"What would you do with an unexpected tax refund?" The responses are summarized in the following table.a. Construct a bar chart for these data.b. How many people will spend the tax refund? R-69 Pay off debts 47% Put it in the bank 30% Spend it
A recent poll of 3,057 individuals asked: "What's the longest vacation you plan to take this summer?" The following relative frequency distribution summarizes the results.a. Construct a frequency distribution of these data. How many people are going to take a one-week vacation this summer?b.
Money magazine (January 2007) reported that an average of 77 million adults in the U.S. make financial resolutions at the beginning of a new year. Consider the following frequency distribution, which reports the top financial resolutions of 1, 026 Americans (Source: MONEY/ICR poll conducted
The Statistical Abstract o f the United States, 2010 provided the following frequency distribution of the number of people who live below the poverty level by region.a. Construct a relative frequency distribution. What percent of people who live below the poverty level live in the Midwest?b.
The one-year return (in %) for 24 mutual funds is as follows:a. Construct a frequency distribution using classes of —20 up to —10, —10 up to 0, etc.b. Construct the relative frequency, the cumulative frequency, and the relative cumulative frequency distributions.c. How many of the funds had
A survey conducted by CBS News asked parents about the professions they would want their children to pursue. The results are summarized in the following table.a. Construct a bar chart and a pie chart for these data.b. How many parents wanted their children to become athletes if the above results
Patrons at a local restaurant were asked to rate their recent experience at the restaurant with respect to its advertised atmosphere of upbeat, comfortable, and clean. Possible responses included Outstanding, Good, OK, and Please Get Help. The following table shows the responses of 28 patrons:a.
A 2003 survey by the Centers for Disease Control and Prevention concluded that smoking is forbidden in nearly 75% of U.S. households (Boston Globe, May 25, 2007). The survey gathered responses from at least 900 households in each state. When residents of Utah were asked whether or not smoking was
In an attempt to determine whether a relationship exists between the price of a home and the number of days it takes to sell the home, a real estate agent collects data on the recent sales of eight homes.Construct a scatterplot. What can the realtor conclude? R-69 Price (in $1,000s) 265 225 Days to
In order to diversify risk, investors are often encouraged to invest in assets whose returns have either a negative relationship or no relationship. The annual return data on two assets is shown below.Construct a scatterplot. For diversity purposes, would the investor be wise to include these
A recent study offers evidence that the more weight a woman gains during pregnancy, the higher the risk of having a high-birth-weight baby, defined as 8 pounds, 13 ounces, or 4 kilograms (The Wall Street Journal, August 5, 2010). Highbirth-weight babies are more likely to be obese in adulthood.The
A statistics instructor wants to examine whether a relationship exists between the hours a student spends studying for the final exam (Hours) and a student's grade on the final exam (Grade). She takes a sample of 8 students.Construct a scatterplot. What conclusions can you draw from the
Construct a scatterplot with the following data. Categorize the relationship between x and y . R-69 X 1 2 3 4 5 y 22 20 18 10 5 64 6 7 4 3 82
Construct a scatterplot with the following data. Does a linear relationship exist between x and y? R-69 10 4 6 3 7 3 2 6 6 4
Construct a scatterplot with the following data. Categorize the relationship between x and y. R-69 3 7 12 5 6 y 22 10 5 14 12
Spain was the winner of the 2010 World Cup, beating the Netherlands by a score of 1–0. The ages of the players from both team s were as follows: R-69Construct a stem-and-leaf diagram for each country.Comment on similarities and differences between the two data sets. R-69 Spain 29 25 23 30 32 21
A police officer is concerned with excessive speeds on a portion o f Interstate 90 w ith a posted speed lim it o f 65 miles per hour. Using his radar gun, he records the following speeds for 25 cars and trucks:Construct a stem-and-leaf diagram. Are the officer's concerns warranted? R-69 66 72 73 82
Suppose the following high temperatures were recorded for major cities in the contiguous United States for a day in July.Construct and interpret a stem-and-leaf diagram. R-69 84 92 96 91 96 94 93 82 81 76 90 95 84 90 84 98 94 90 83 78 88 96 106 78 92 98 91 84 80 94 94 93 107 87 77 99 94 73 74 92
A sample of patients arriving at Overbrook Hospital's emergency room recorded the following body temperature readings over the weekend:Construct and interpret a stem-and-leaf diagram. R-69 100.4 99.6 101.5 99.8 102.1 101.2 102.3 101.2 102.2 102.4 101.6 101.5 99.7 102.0 101.0 102.5 100.5 101.3 101.2
Consider the following data set:Construct a stem-and-leaf diagram. Is the distribution symmetric? Explain. R-69 -64 -52 -73 -82-85-80 -79 -65-50-71 80 -85-75-65-77-87-72-83 -73-80
Consider the following data set:Construct a stem-and-leaf diagram. Is the distribution symmetric? Explain. R-69 5.4 4.6 3.5 2.8 2.6 5.5 5.5 2.3 3.2 4.2 4.0 3.0 3.6 4.5 4.7 4.2 3.3 3.2 4.2 3.4
The manager of a nightclub near a local university recorded the ages of the last 100 guests in the following cumulative frequency distribution.a. Construct the corresponding frequency, relative frequency, and cumulative relative frequency distributions.b. How many of the guests were at least 26 but
The following relative frequency distribution summarizes the ages of women who had a child in the last year.a. Assume the relative frequency distribution is based on a sampling of 2,000 women. Construct the corresponding frequency distribution, cumulative frequency distribution, and cumulative
Fifty cities provided information on vacancy rates (in percent)in local apartments in the following frequency distribution.a. Construct the corresponding relative frequency distribution, cumulative frequency distribution, and cumulative relative frequency distribution.b. How many of the cities had
The following table lists a portion of the average math SAT scores for each state for the year 2009.The complete data set can be found on the text website and is labeled Math SAT 2009.a. Construct a frequency distribution using classes of 450 to 500, 501 to 550, etc. How many of the states had
AccuWeather.com listed the following high temperatures(in degrees Fahrenheit) for 33 European cities on July 21, 2010.a. Construct a frequency distribution using classes of 60 up to 70, 70 up to 80, etc.b. Construct the relative frequency, the cumulative frequency, and the relative cumulative
Showing 3100 - 3200
of 6020
First
25
26
27
28
29
30
31
32
33
34
35
36
37
38
39
Last
Step by Step Answers