New Semester
Started
Get
50% OFF
Study Help!
--h --m --s
Claim Now
Question Answers
Textbooks
Find textbooks, questions and answers
Oops, something went wrong!
Change your search query and then try again
S
Books
FREE
Study Help
Expert Questions
Accounting
General Management
Mathematics
Finance
Organizational Behaviour
Law
Physics
Operating System
Management Leadership
Sociology
Programming
Marketing
Database
Computer Network
Economics
Textbooks Solutions
Accounting
Managerial Accounting
Management Leadership
Cost Accounting
Statistics
Business Law
Corporate Finance
Finance
Economics
Auditing
Tutors
Online Tutors
Find a Tutor
Hire a Tutor
Become a Tutor
AI Tutor
AI Study Planner
NEW
Sell Books
Search
Search
Sign In
Register
study help
business
statistical sampling to auditing
Statistical Methods For The Social Sciences 5th Global Edition Alan Agresti - Solutions
A study is planned about whether playing violent video games before the age of 10 has an impact on antisocial behavior.(a) One possible study would take a sample of children under 10 and randomly select half of them to play violent video games, while the other half would not be exposed.Then 10
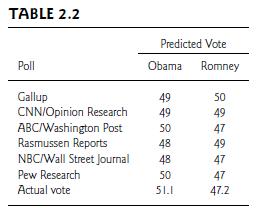
Table 2.2 shows the result of the 2012 Presidential election and the predictions of several organizations in the days before the election. The sample sizes were typically about 2000. (The percentages for each poll do not sum to 100 because of voters reporting as undecided or favoring another
Identify the type of sampling bias in each of the following studies. Explain.(a) A graduate student is researching TV viewing habits.She posts a link to her questionnaire on her social media sites and receives 46 responses.(b) Educational researchers want to examine the effectiveness of an
A national polling organization surveyed 1751 individuals to investigate their opinion on public transportation services. One question in the survey was: “How happy or unhappy are you with current national highway tolls and the national railway service?” When calculating the results, the
Afarmhouse has a population of 5067 animals.Aresearcher is keen to study the effect of a drug on the milk production of cows.(a) How will the researcher select a sample of 10 cows from the farmhouse with a population of 560 cows? Explain the steps using systematic random sampling.(b) Suppose in the
You plan to sample from the 6000 students at a college to compare the proportions of men and women who believe that capital punishment should be abolished. Explain how you would proceed if you want a systematic random sample of 200 students.
You plan to sample from the 15,000 students enrolled at your university to compare the proportions of medical students and law students who believe that social media has a positive impact on their lives.(a) Suppose that you use random numbers to select students but you stop selecting law students
In stratified random sampling, what is the difference between a proportional and a disproportional stratified random sample?(a) Which sampling method combines different sampling techniques?(b) Which type of sampling is best when a complete list of population is not available?
Refer to the Students data file introduced in Exercise 1.11 (page 21). For each variable in the data set, indicate whether it is(a) Categorical or quantitative.(b) Nominal, ordinal, or interval.
Repeat the previous exercise for the data file created in Exercise 1.12 (page 22).
You are directing a research to study different aspects of the refugee crisis.(a) Give at least two research problems that you would like to study.(b) What will be the characteristics of the sample that you wish to study? How will you measure the variables?(c) What will be your choice of method to
A researcher wants to study the opinions of people about social media. For this, the researcher takes into consideration all the states/districts of his/her country and calls them clusters. Further, a simple random sample is drawn from the clusters listed.What could be the possible advantage of
A social psychology website conducts a survey online using the volunteer sampling method. The survey collects information about a newly launched clothing brand.It asks the subjects, “Would you rate this brand as the best in the market?” Explain briefly what volunteer sampling is. Discuss
In each of the following situations, evaluate whether the method of sample selection is appropriate for obtaining information about the population of interest. How would you improve the sample design?(a) ATV talent show with a viewership of 2 million wants to find out whether viewers prefer to have
A researcher wants to analyze the relation between months in a year and the rate of depression among people.The study aims to see whether certain months report more number of cases of depression. The sampling frame consists of number of depression cases for each month for the past five years. What
Why might a researcher choose to use a systematic random sample? Explain.
With a total sample size of 150, you want to compare the study techniques of students majoring in engineering to other students at your university. What would be the best way to sample your study?Why?
Explain with an example the steps involved in multistage sampling. How is it different from cluster sampling?
Look for websites on social surveys on the Internet like the General Social Survey (GSS), World Values Survey, World Economic Forum, etc. Find three studies from different domains and report the following:(a) The variables used in the studies and their scale of measurement.(b) The sampling method
To sample residents of registered nursing homes in Yorkshire, UK, I construct a list of all nursing homes in the county, which I number from 1 to 110. Beginning randomly, I choose every 10th home on the list, ending up with 11 homes. I then obtain lists of residents from those 11 homes, and I
A simple random sample of size n is one in which(a) Every nth member is selected from the population.(b) Each possible sample of size n has the same chance of being selected.(c) There must be exactly the same proportion of women in the sample as is in the population.(d) You keep sampling until you
If we use random numbers to take a simple random sample of 50 students from the 3500 undergraduate students at the University of Rochester,(a) It is impossible to get the random number 1111, because it is not a random sequence.(b) If we get 2001 for the first random number, for the second random
An analysis5 of published medical studies involving treatments for heart attacks noted that in the studies having randomization and strong controls for bias, the new therapy provided improved treatment 9% of the time. In studies without randomization or other controls for bias, the new therapy
Keeping in mind the importance of survey design and wording, you want to investigate the percentage of students who have cheated in exams and assignments.From your random sample of 1478 students from a total student population of 10000, the percentage that admits to cheating is 28%. Why might this
Explain how voluntary surveys may not represent a random sample.
A national news network asks viewers to call in to participate in a poll about whether or not viewers believe crime has increased over the past five years. About 10000 viewers call in, with 72% reporting that they believe crime has increased. True or false: Since everyone had a chance to call, this
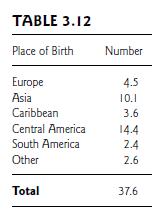
Table 3.12 shows the number (in millions) of the foreign-born population of the United States, by place of birth.(a) Construct a relative frequency distribution.(b) Sketch the data in a bar graph.(c) Is “place of birth” quantitative, or categorical?(d) Use whichever of the following measures is
According to a survey done by a large technology firm, the number of Internet users was 630 million in China, 400 million in Europe, and 290 million in the United States.(a) Construct a relative frequency distribution.(b) Sketch a bar graph.(c) Can you find a mean, median, or mode for these data?If
A teacher shows her class the scores on the midterm exam in the stem-and-leaf plot:6 | 5 8 8 7 | 0 1 1 3 6 7 7 9 8 | 1 2 2 3 3 3 4 6 7 7 7 8 9 9 | 0 1 1 2 3 4 4 5 8(a) Identify the number of students and the minimum and maximum scores.(b) Sketch a corresponding histogram with four intervals.
A countrywide demographical survey of a population revealed that 43.2 million people had black-colored eyes, 12.1 million people had hazel-colored eyes, 26.7 million people had brown-colored eyes, 17.4 million people had green-colored eyes, and 10.0 million people had graycolored eyes.(a) Make a
Create a data file with your software for the Crime data file from the text website. Use the variable murder, which is the murder rate (per 100,000 population). Using software,(a) Construct a relative frequency distribution.(b) Construct a histogram. How would you describe the shape of the
The OECD (Organization for Economic Cooperation and Development) consists of advanced, industrialized countries that accept the principles of representative democracy and a free market economy. Table 3.13 shows part of the OECD data file at the text website that has data on several variables for
Refer to the prison values in the previous exercise.(a) Find the mean and the median.(b) Based on a histogram or box plot for these data, why would you expect the mean to be larger than the median?(c) Identify an outlier. Investigate how it affects the mean and the median by recalculating them
A study conducted by a world opinion website on the number of Internet users across different countries revealed the following data: 11.6 million in Singapore, 69.8 million in Japan, 22.1 million in France, 14.2 million in Belgium, 14.1 million in Austria, and 12.7 million in Bangladesh.(a) Find
In order to develop a new line of hair dye, a cosmetics company poll asked, “What color best describes your natural hair?” (black, brown, blonde, red), the percentage of responses were 31%, 54%, 7% and 3%, respectively.(a) Which response is the mode?(b) Can you compute a mean or a median for
A researcher in an alcoholism treatment center, to study the length of stay in the center for first-time patients, randomly selects 10 records of individuals institutionalized within the previous two years. The lengths of stay, in days, were 11, 6, 20, 9, 13, 4, 39, 13, 44, and 7. For a similar
Access the GSS at sda.berkeley.edu/GSS. Entering TVHOURS for the variable and year(2014) in the selection filter, you obtain data on hours per day of TV watching in the United States in 2014.(a) Construct the relative frequency distribution for the values 0, 1, 2, 3, 4, 5, 6, 7 or more.(b) How
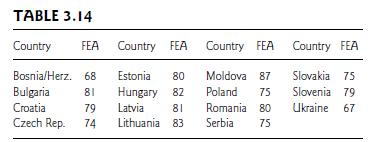
Table 3.14 shows 2012 female economic activity(FEA) for countries in Eastern Europe. Construct plots and find summary statistics to compare these values with those from the Middle East in Table 3.4.Interpret. TABLE 3.14 Country FEA Country FEA Country FEA Country FEA Bosnia/Herz. 68 Estonia 80
Calculate the weighted average for two sets of sample where n1 = 12, n2 = 5, ¯y1 = 360, and ¯y2 = 211. The weighted average is close to which sample mean?
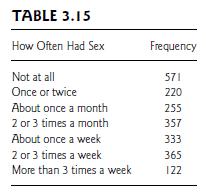
Table 3.15 summarizes responses of 2223 subjects in the 2014 GSS to the question “About how often did you have sex during the last 12 months?”(a) Report the median and the mode. Interpret.(b) Treat this scale in a quantitative manner by assigning the scores 0, 0.1, 1.0, 2.5, 4.3, 10.8, and 17
A survey conducted on a sample of employees from an organization asked, “How would you rate yourself on a scale of happiness?” The responses ranged from extremely happy, very happy, somewhat happy, neutral, somewhat unhappy, very unhappy, to extremely unhappy.The counts in each category were
According to a study done by an educational research organization, the median tuition cost for a private university was $32,500 per year and $17,350 per year for a public university, whereas the mean was $34,000 for private universities and $19,500 for public universities.(a) Does this suggest that
A national polling organization conducts a research study on the median amount of money spent on grooming products. Women spent $2,350 in the past year and men spent $866 in the past year.(a) Identify the response variable and the explanatory variable for this analysis.(b) Is enough information
The General Social Survey has asked, “During the past 12 months, how many people have you known personally that were victims of homicide?” Table 3.16 shows software output from analyzing responses.(a) Is the distribution bell shaped, skewed to the right, or skewed to the left?(b) Does the
According to an article reported by en.wikipedia.org on the top oil producers in 2011, the oil production(measured in metric ton, mt) was 517 for Saudi Arabia, 510 forRussia, 215 for Iran, 203 for China, 139 for Nigeria, 144 for the UAE, and 144 for Mexico.(a) Calculate the mean and the median.(b)
National Geographic Traveler magazine recently presented data on the annual number of vacation days averaged by residents of eight different countries. They reported 42 days for Italy, 37 for France, 35 for Germany, 34 for Brazil, 28 for Britain, 26 for Canada, 25 for Japan, and 13 for the United
The Human Development Index (HDI) is an index the United Nations uses to give a summary rating for each nation based on life expectancy at birth, educational attainment, and income. In 2014, the 10 nations (in order)with the highestHDIrating, followed by the percentage of seats in their parliament
A report published by a survey agency on the number of female workers (in millions) in each country revealed the following data. For Western Europe, the values were as follows: Germany, 86; Norway, 89; France, 72;Ireland, 77; Finland, 81; Greece, 85; the United Kingdom, 89; Belgium, 73; Italy, 79;
A report indicates that teacher’s total annual pay(including bonuses) in Toronto, Ontario, has a mean of$61,000 and standard deviation of $10,000 (Canadian dollars).Suppose the distribution has approximately a bell shape.(a) Give an interval of values that contains about (i) 68%,(ii) 95%, (iii)
Excluding the United States, the national mean number of holiday and vacation days in a year for OECD nations (see Exercise 3.6) is approximately bell shaped with a mean of 35 days and standard deviation of 3 days.3(a) Use the Empirical Rule to describe the variability.(b) The observation for the
For GSS data on “the number of people you know who have committed suicide,” 88.8% of the responses were 0, 8.8% were 1, and the other responses took higher values. The mean equals 0.145, and the standard deviation equals 0.457.(a) What percentage of observations fall within one standard
A sample of 100 voters completed a questionnaire regarding their level of satisfaction with the current government.The scores on the questionnaire ranged between 25 and 150. The mean of the sample was 92.Which of the following value can be a possible standard deviation for this sample: 0, −92,
Why is standard deviation preferred in place of variance to explain variability?
According to an online survey, the average number of hours spent by a person on the Internet is 12.Which of the following values seems the most realistic in terms of standard deviation:(i) 5, (ii) 0, (iii) −5, (iv) 32, (v) 64?Why?
For all homes in Gainesville, Florida, the annual residential electrical consumption4 recently had a mean of 10,449 and a standard deviation of 7489 kilowatt-hours(kWh). The maximum usage was 336,240 kWh.(a) What shape do you expect this distribution to have?Why?(b) Do you expect this distribution
Arecent study5 of the effect of work hours and commuting time on political participation estimated that for those engaged in paid work in the United States, the time it takes on a typical day to get to work has a mean of 19.8 minutes and standard deviation of 13.6 minutes.What shape do you expect
According to Statistical Abstract of the United States, 2015, the mean salary (in dollars) of secondary school teachers in the United States varied among states with a five-number summary of 100% Max 68,800 (New York)75% Q3 54,700 50% Med 45,500 25% Q1 43,100 0% Min 37,700 (South
Refer to the previous exercise.(a) Sketch a box plot.(b) Based on (a), predict the direction of skew for this distribution.Explain.(c) If the distribution, although skewed, is approximately bell shaped, which value is most plausible for the standard deviation:(i) 100, (ii) 1000, (iii) 7000, (iv)
Table 3.17 shows part of software output for analyzing the murder rates (per 100,000) in the Crime2 data TABLE 3.17 Variable = MURDER n 51 n 50 Mean 5.6 Mean 4.8 Std Dev 6.05 Std Dev 2.57 Quartiles Quartiles 100% Max 44 100% Max 13 75% Q3 6 75% Q3 6 50% Med 5 50% Med 5 25% Q1 3 25% Q1 3 0% Min 1 0%
The text website has a data file Houses that lists recent selling prices of 100 homes in Gainesville, Florida.Software reports ¯y = $155, 331, s = $101, 262, and a fivenumber summary of minimum = $21, 000,Q1 = $91, 875, median = $132,600, Q3 = $173, 875, and maximum =$587,000.(a) Does the
For the following examples, discuss the shape of the distribution by giving a valid explanation.(a) The mean score on a mathematics test was 67 and the median was 44.(b) In a sample of 100 infants, the average number of hours slept was 18 and the median was 22.(c) The most frequently occurring
For each of the following variables, indicate whether you would expect its relative frequency histogram to be bell shaped, U-shaped, skewed to the right, or skewed to the left.(a) Exam score of easy exam (with ¯y = 88, s = 10, minimum= 65, Q1 = 77, median = 85, Q3 = 91, and maximum= 100).(b) IQ
For parts (a), (b), and (f) of the previous exercise, sketch box plots that would be plausible for the variable.
The January 2014 unemployment rates of adults of age 24 or less in the 28 countries in the European Union ranged from 7.9 (Germany) to 57.3 (Greece), with lower quartile = 18.9, median = 23.7, upper quartile = 33.5, mean = 26.0, and standard deviation =
Sketch a box plot, labeling which of these values are used in the plot.
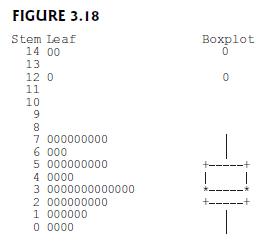
For the number of times a week reading a newspaper, from the Students data file referred to in Exercise 1.11, Figure 3.18 shows software output (rather crude)of the stem-and-leaf plot and the box plot.(a) From the box plot, identify the minimum, lower quartile, median, upper quartile, and
Infant mortality rates (number of infant deaths, per 1000 live births) are reported by theWorld Bank. In their report for 2010–2014, the five-number summaries (min, Q1, median, Q2, max) were (19, 55, 74, 86, 107) for Africa and (2, 3, 4, 4, 6) for Europe. Sketch side-by-side box plots, and use
In 2013, the five-number summary for the U.S.statewide percentage of people without health insurance had minimum = 4% (Massachusetts), Q1 = 10%, Med =12%, Q3 = 15%, and maximum = 20% (Texas).(a) Sketch a box plot.(b) Do you think that the distribution is symmetric, skewed to the right, or skewed to
For a national graduation examination scored out of 110, the 2016 results were reported as minimum = 30, lower quartile = 41, median = 66, upper quartile = 74, and maximum = 93.(a) Report and interpret the range and interquartile range.(b) Calculate the outliers low observations and the high
Using software, analyze the murder rates from the Crime data file at the text website.(a) Find the five-number summary.(b) Construct a box plot, and interpret.(c) Repeat the analyses, adding the D.C. murder rate of 15.9 to the data file, and compare results.
Areport by the OECD6 indicated that annual water consumption for nations in the OECD (see Exercise 3.6)was skewed to the right, with values (in cubic meters per capita) having a median of about 500 and ranging from about 200 in Denmark to 1700 in the United States Consider the possible values for
According to values from Table 3.9, for the nations in the European Union (EU) excluding Luxembourg, carbon dioxide emissions (metric tons per capita) had a mean of 7.4 and standard deviation of 1.7.(a) How many standard deviations above the mean was the value of 20.9 for Luxembourg?(b) Sweden’s
The United Nations publication Energy Statistics Yearbook lists consumption of energy (unstats.un.org/unsd/energy). For the 27 nations that made up the European Union (EU) in 2011, the energy values(in kilowatt-hours per capita) had a mean of 5963 and a standard deviation of 2292.(a) France had a
A study compares three types of personalities (Extrovert, Ambivalent, Introvert) on their level of sociability, that is, very social, social, asocial.(a) In this study, identify the explanatory variable and the response variable.(b) How will you display this data in a contingency table?
Table 3.18 shows reported happiness for those subjects in the 2014 GSS who attend religious services rarely and for those who attend frequently.(a) Identify the response variable and the explanatory variable.(b) At each level of religious attendance, find the percentage who reported being very
For 2014WorldBank data (data.worldbank.org)for several nations, a prediction equation relating fertility(the mean number of children per adult woman) and percentage of people using the Internet is Predicted fertility = 3.20 − 0.02(Internet use).(a) Compare the predicted fertility of a nation with
Refer to the previous exercise. Using regression, the prediction equation relatingGDP(in thousands of dollars per capita) to carbon dioxide emissions (in metric tons per capita) is Predicted CO2 = 1.93 + 0.178(GDP).(a) What type of pattern would you expect for the points in a scatterplot for these
For the data for OECD nations in Table 3.13 in Exercise 3.6 and in the UN data file, use software to construct a scatterplot relating x = carbon dioxide emissions (CO2)and y = fertility rate.(a) Based on this plot, would you expect the correlation between these variables to be positive, or
Using national surveys, the Pew Research Center has estimated the percent of people who say that religion plays a very important role in their lives.Values forOECD nations (with GDP values in parentheses from the OECD data file) include Australia 21% (43,550), Canada 25%(43,247), France 14%
What is the difference between the descriptive measures symbolized by (a) ¯y and μ? (b) s and σ?Concepts and Applications
For the Students data file at the text website (see Exercise 1.11 on page 21), use software to conduct graphical and numerical summaries for (a) distance from home town, (b) weekly hours of TV watching. Describe the shapes of the distributions, and summarize your findings.
Refer to the data file your class created for Exercise 1.12 (page 22). For variables chosen by your instructor, conduct descriptive statistical analyses. In your report, give an example of a research question that could be addressed using your analyses, identifying response and explanatory
Table 3.19, the Guns data file at the text website, shows annual homicide rates (including homicide, suicide, TABLE 3.19 Gun Gun Gun Nation Deaths Nation Deaths Nation Deaths Australia 1.1 (15) Greece 5.9 (22) Norway 0.4 (31)Austria 1.8 (30) Iceland 3.2 (30) Portugal 4.8 (8)Belgium 2.9 (17) Israel
In 2014, UNICEF reported child poverty rates7 for many nations in 2012 and in 2008. In 2012, values in Scandinavia were Norway 5.3%, Finland 8.8%, Denmark 10.2%, and Sweden 12.1%, and values in North America were Canada 20.8%, United States 32.2%, and Mexico 34.3%.(a) Use descriptive statistical
For Table 3.9, pose a research question for two variables relating to the direction of their association, identifying the response variable and explanatory variable.Using software, construct a scatterplot and find the correlation. Interpret, and indicate what they suggest about the research
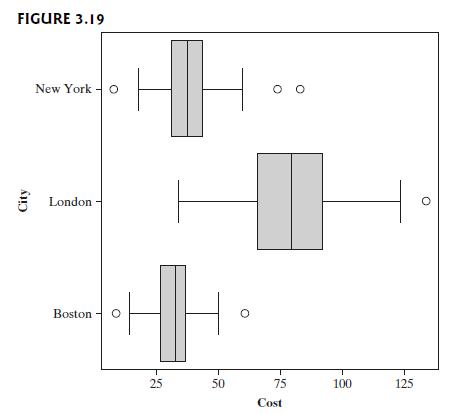
Zagat restaurant guides publish ratings of restaurants for many large cities around the world (see www.zagat.com). The review for each restaurant gives a verbal summary as well as a 0-to-30-point rating of the quality of food, decor, service, and the cost of a dinner with one drink and tip. Figure
Use software to load the UN data file shown in Table 3.9.(a) Conduct a descriptive statistical analysis of the prison rates. Summarize your conclusions, highlighting any unusual observations.(b) Use scatterplots and correlations to investigate the association between prison rate and the other
For Table 3.19, construct a scatterplot to investigate the association between gun deaths and number of firearms. Identify the effect of any outlier.
The Internet site www.pearsonglobaleditions.com/Agresti has useful applets for illustrating data analyses and properties of statistical methods.(a) Using the Explore Quantitative Data applet, construct a sample of 20 observations on y = number of hours of physical exercise in the past week having
When a distribution is highly skewed, which describes the typical value better, the median or the mean?Which one is more likely to be impacted by outliers, the median or the mean?
What is the size of the mean compared to the median when a distribution skews to the left? What about when it skews to the right?
The fertility rate (mean number of children per adult woman) varies in European countries between a low of 1.2 (Poland and Portugal) and a high of 1.9 (Ireland and France). For each woman, the number of children is a whole number, such as 0 or 1 or 2. Explain why it makes sense to measure a mean
According to a national weather service, during the month of June 2016,4% of days were 20◦ Celsius or lower, 10% were 21◦ Celsius or lower, 26% were 22◦ Celsius or lower, 48% were 24◦ Celsius or lower, 67% were 25◦ Celsius or lower, and 96% were 27◦ Celsius or lower. These are called
Give an example of a variable for which the mode applies, but not the mean or median.
Give an example of a variable having a distribution that you expect to be (a) approximately symmetric, (b)skewed to the right, (c) skewed to the left, (d) bimodal,(e) skewed to the right, with a mode and median of 0 but a positive mean.
To measure center, why is the (a) median sometimes preferred over the mean? (b) mean sometimes preferred over the median? In each case, give an example to illustrate your answer.
To measure variability, why is(a) The standard deviation s usually preferred over the range?(b) The IQR sometimes preferred to s?
Answer true or false to the following:(a) The mean, median, and mode can never all be the same.(b) The mean is always one of the data points.(c) The median is the same as the second quartile and the 50th percentile.(d) For 67 sentences for murder recently imposed using U.S. Sentencing Commission
A national polling organization reported a recent survey of levels of education (high school, some college, college, master’s, doctorate/professional). For level of education, the frequencies were (48%, 11%, 24%, 9%, 7%), respectively.(a) The median level of education is
A national survey asked whether capital punishment is (always wrong, almost always wrong, wrong only sometimes, not wrong at all). The response counts in these four categories were (621, 172, 112, 275). This distribution is(a) Skewed to the right.(b) Approximately bell shaped.(c) Somewhat bimodal,
Showing 4500 - 4600
of 4976
First
36
37
38
39
40
41
42
43
44
45
46
47
48
49
50
Step by Step Answers