New Semester
Started
Get
50% OFF
Study Help!
--h --m --s
Claim Now
Question Answers
Textbooks
Find textbooks, questions and answers
Oops, something went wrong!
Change your search query and then try again
S
Books
FREE
Study Help
Expert Questions
Accounting
General Management
Mathematics
Finance
Organizational Behaviour
Law
Physics
Operating System
Management Leadership
Sociology
Programming
Marketing
Database
Computer Network
Economics
Textbooks Solutions
Accounting
Managerial Accounting
Management Leadership
Cost Accounting
Statistics
Business Law
Corporate Finance
Finance
Economics
Auditing
Tutors
Online Tutors
Find a Tutor
Hire a Tutor
Become a Tutor
AI Tutor
AI Study Planner
NEW
Sell Books
Search
Search
Sign In
Register
study help
business
statistical sampling to auditing
Statistical Methods For The Social Sciences 5th Global Edition Alan Agresti - Solutions
For Example 11.2 on mental impairment, Table 11.21 shows the result of adding religious attendance as an explanatory variable, measured as the approximate number of times the subject attends a religious service over the course of a year. Write a report of about 200 words interpreting the
Using the most recent General Social Survey, construct a contingency table relating gender (GSS variable SEX) and party identification (PARTYID). Is there still a gender gap? Control for political ideology (the GSS variable POLVIEWS) by forming partial tables for the most conservative and the most
For the Students data (Exercise 1.11), are there any pairs of variables for which you expect the association to disappear under control for a third variable? Explain.
Refer to the Students data file (Exercise 1.11 on page 21). Construct partial tables relating opinion about abortion to opinion about life after death, controlling for attendance at religious services, measured using the two categories (Never or occasionally, Most weeks or every week). Prepare a
A study of students at Oregon State University found an association between frequency of church attendance and favorability toward the legalization of marijuana.Both variables were measured in ordered categories.Controlling for gender, the gamma measures for the two partial tables were Males:
A study7 of mortality rates found in the United States that states with higher income inequality tended to have higher mortality rates. The effect of income inequality disappeared after controlling for the percentage of a state’s residents who had at least a high school education.Explain how
A study of the association between whether a smoker (yes, no) and whether have had some form of cancer (yes, no) has odds ratio 1.1 for subjects of age less than 30, 2.4 for subjects of age 30 to 50, and 4.3 for subjects of age over 50.(a) Identify the response variable, explanatory variable, and
For lower-level managerial employees of a fastfood chain, the prediction equation relating y = annual income (thousands of dollars) to x1 = number of years of experience on the job is ˆy = 14.2 + 1.1x1 for males andˆy = 14.2+0.8x1 for females. Explain how these equations show evidence of
According to the U.S. Census Bureau, in 2013 the population median income was estimated to be $29,127 for white females, $26,006 for black females, $41,086 for white males, and $30,394 for black males. Compare the difference in median incomes between males and females for (a) white subjects, (b)
When we analyze data for the census tracts in the greater Los Angeles area, we find no significant correlation between median tax bill and median lot size. Yet a considerable positive correlation occurs when we control for the percentage of the tract used for business. Explain how the percentage of
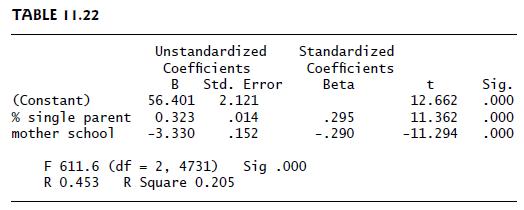
A study8 relating the percentage of a child’s life spent in poverty to the number of years of education completed by the mother and the percentage of a child’s life spent in a single-parent home reported the results shown in Table 11.22.Prepare a one-page report explaining how to interpret the
Table 10.8 relates y = exam score (1 = below median, 2 = above median) to gender, controlling for the subject of the exam (Math, Verbal). Show that subject of exam is a suppressor variable.TABLE 10.8 Math Verbal Gender y = 1 y = 2 y = 1 y = 2 Females 100 50 50 100 Males 50 100 100 50
Table 10.7 lists the mean salary, in thousands of dollars, of faculty on nine-month contracts in U.S. institutions of higher education in 2013–2014, by gender and academic rank.(a) Suppose that gender is the explanatory variable. Identify the response variable and the control variable.(b)
Opposition to the legal availability of abortion is stronger among the very religious than the nonreligious, and it is also stronger among those with conservative sexual attitudes than those with more permissive attitudes. Draw a three-variable diagram of how these variables might be related,
For the Florida data file (shown partly on page 295), giving countywide data in Florida for several variables, a moderate positive correlation (r = 0.47) exists between crime rate and the percentage who are high school graduates. The percentage living in urban areas is also strongly correlated with
For the data on house sales shown partly in Table 9.5 on page 280, the number of bedrooms has a moderately strong positive correlation with selling price.Controlling for size of home, however, this association diminishes greatly.(a) Explain how this could happen, illustrating with a diagram showing
The Economist magazine9 developed a quality-oflife index for nations as the predicted value obtained by regressing an average of life-satisfaction scores from several surveys on gross domestic product (GDP, per capita, in dollars), life expectancy (in years), an index of political freedom (from 1 =
A study at your university finds that of those who applied to its graduate school last year, the percentage admitted was higher for the male applicants than for the female applicants. However, for each department that received applications, the percentage admitted was lower for the male applicants
Suppose race is related to frequency of juvenile arrests, with black juveniles more likely to be arrested than white juveniles. A possible chain relationship explanation is that (1) race affects family income, with blacks tending to have lower family incomes than whites, and(2) being poor increases
A study found that children who eat breakfast get better math grades than those who do not eat breakfast.This result was based on the association between x =whether eat breakfast (yes, no) and y = grade in last math course taken. How might this result be spurious, and how could you check for that
An Associated Press story quoted a study at the University of California at San Diego that reported, based on a nationwide survey, that those who averaged at least 8 hours of sleep a night were 12 percent more likely to die within six years than those who averaged 6.5 to 7.5 hours of sleep a
Figure 9.16 on page 286 showed a negative correlation between birth rate and television ownership. Identify a variable to help explain how this association could be spurious.
Explain what is meant by a spurious association, drawing a scatter diagram to illustrate.(a) Illustrate using x1 = shoe size, x2 = age, and y = number of books one has ever read, for children from schools in Winnipeg, Canada.(b) Illustrate using x1 = height, x2 = gender, and y =annual income, for a
Explain what it means to control for a variable, using an example to illustrate.
An association exists between college GPA and whether a college student has ever used marijuana.Explain how(a) The direction of a causal arrow might go in either direction.(b) A third variable might be responsible for the association.
Cities in the United States have a positive correlation between y = crime rate and x = size of police force.Does this imply that x causes y? Explain.
For all fires in Chicago last year, data are available on x = number of firefighters at the fire and y = cost of damages due to the fire. The correlation is positive.(a) Does this mean that having more firefighters at a fire causes the damage to be worse? Explain.(b) Identify a third variable that
A young child wonders what causes women to have babies. For each woman who lives on her block, she observes whether her hair is gray and whether she has young children. The four women with gray hair do not have young children, whereas all five women not having gray hair have young children.
State the three criteria for a causal relationship. For each, describe a relationship between two variables that is not causal because that criterion would be violated.
9.68.* From the formulas for b(page 264) and r (page 272), show that r = bsx/sy.
An article10 used multiple regression to predict a measure of tolerance toward homosexuality.(a) The researchers found that the effect of number of years of education varied from essentially no effect for political conservatives to a considerably positive effect for political liberals. Explain how
9.66.* Refer to the formula a = ¯y−b¯x for the y-intercept.(a) Show that substituting x = ¯x into the prediction equation ˆy = a + bx yields the predicted y-value of ˆy = ¯y.Show that this means that the least squares prediction equation passes through the point with coordinates ( ¯x,
9.64.* A confidence interval for a population correlationρ requires a transformation of r, T = (1/2) loge[(1 +r)/(1 − r)], for which the sampling distribution is approximately normal, with standard error 1/√n − 3. Once we get the endpoints of the interval for the population value of T, we
9.63.* Observations on both x and y are standardized, having estimated means of 0 and standard deviations of 1 (see Section 4.3). Show that the prediction equation has the form ˆy = rx, where r is the sample correlation between x and y. That is, for the standardized variables, the y-intercept
9.62.* A study by the National Highway Traffic Safety Administration estimated that 73% of people wear seat belts, that failure to wear seat belts led to 9200 deaths in the previous year, and that that value would decrease by 270 for every 1 percentage point gain in seat belt usage.Let ˆy =
The slope of the least squares prediction equation and the correlation are similar in the sense that(a) They do not depend on the units of measurement.(b) They both must fall between −1 and +1.(c) They both have the same sign.(d) They both equal 1 when there is the strongest association.(e) Their
The correlation is inappropriate as a measure of association between two quantitative variables(a) When different people measure the variables using different units.(b) When the relationship is highly nonlinear.(c) When the data points fall exactly on a straight line.(d) When the slope of the
An article11 that analyzed the effects of the levels of the participant’s generosity and of the spouse’s generosity on a measure of marital quality reported that low levels of both were associated with low marital quality and high levels of both were associated with high marital quality.
One can interpret r = 0.60 as follows:(a) A60% reduction in error occurs in using x to predict y.(b) A 9% reduction in error occurs in using x to predict y compared to using ¯y to predict y.(c) 9% of the time ˆy = y.(d) y changes 0.60 units for every one-unit increase in x.(e) When x predicts y,
The variables y = annual income (thousands of dollars), x1 = number of years of education, and x2 =number of years of experience in job are measured for all the employees having city-funded jobs, in Knoxville, Tennessee. The following prediction equations and correlations apply:i. ˆy = 10 + 1.0x1,
Estimating a single mean μ corresponds to estimating the parameter in the simple model, E(y) = μ. Use this fact to explain why the estimate sy of the standard deviation of the marginal distribution has df = n − 1.
Explain carefully the interpretations of the standard deviations (a) sy, (b) sx, (c) s =square root of residualMS,(d) se for b.
Explain why the correlation between x = number of years of education and y = annual income is likely to be smaller if we use a random sample of adults who have a college degree than if we use a random sample of all adults.
For which student body do you think the correlation between high school GPAand college GPAwould be higher: Yale University or the University of Bridgeport, Connecticut? Explain why.
Refer to Exercise 9.39.For these counties, the correlation between high school education rate and median income equals 0.79.Suppose we also have data at the individual level as well as aggregated for a county. Sketch a scatterplot to show that at the individual level, the correlation could be much
A study by the Readership Institute10 at Northwestern University used survey data to analyze how reader behavior was influenced by the Iraq war. The response variable was a Reader Behavior Score (RBS), a combined measure summarizing newspaper use frequency, time spent with the newspaper, and how
In Exercise 11.1 on y = college GPA, x1 = high school GPA, and x2 = college board score, E(y) = 0.20 + 0.50x1 + 0.002x2. True or false: Since β1 = 0.50 is larger than β2 = 0.002, this implies that x1 has the greater partial effect on y. Explain.
For a total of 100 salesmen in a firm, the 10 who perform poorest in the first quarter are enrolled in a special training program. The overall sales mean is 70 in both the first and the last quarter, but the mean for the specially trained employees increases from 50 to 60. Use the concept of
State the assumptions in fitting and making inferences with the model E(y) = α + βx.Which assumptions are most critical? In view of these assumptions, indicate why the model might not be adequate for(a) x = income, y = charitable contributions within the previous year. (Hint: Would poor people
A magazine article9 reported results of a study suggesting that “each extra year of schooling makes someone 10% less likely to describe himself as religious.” Explain how the 10% could be a slope estimate from a regression analysis, but the prediction equation obtained would apply over a
Annual income, in dollars, is an explanatory variable in a regression analysis. For a British version of the report on the analysis, all responses are converted to British pounds sterling (1 pound equals about 1.33 dollars, as of 2016).(a) How, if at all, does the slope of the prediction equation
For counties in a particular state, crime rate (number of crimes per thousand residents) in the past two years varies around a mean = 50 with standard deviation = 20.The crime rate last year has correlation 0.50 with the crime rate this year. Last year, the crime rate was 100 for the county having
Explain why conditional variability can be much less than marginal variability, using the relationship between y = weight and x = age for a sample of boys of ages 2–12, for which perhaps σy = 30 but the conditionalσ = 10.
Table 11.24 shows results of fitting various regression models to data on y = college GPA, x1 = high school GPA, x2 = mathematics entrance exam score, and x3 =verbal entrance exam score. Indicate which of the following statements are false. Give a reason for your answer.TABLE 11.24 Model Estimates
A recent survey reported that the mean total earnings that a worker in Country X can expect to earn between ages 25 and 64 is $1 million for those with only a high school education and $3 million for those with a doctoral degree.(a) Assuming eight years for a doctoral degree and a straight-line
The headline of an article in the Gainesville Sun newspaper stated, “Height can yield a taller paycheck.”It described an analysis of four large studies in the United States and Britain by a University of Florida professor on subjects’ height and salaries. The article reported that for each
A study,8 after pointing out that diets high in fats and sugars (bad for our health) are more affordable than diets high in fruit and vegetables (good for our health), reported, “Every extra 100 g of fats and sweets eaten decreased diet costs by 0.05 to 0.4 Euros, whereas every extra 100 g of
Refer to the UN data for several nations shown in Table 3.9 (page 65) and given at the text website. Using software, obtain the correlation matrix. Which pairs of variables are highly correlated? Describe the nature of those correlations, and inspect scatterplots to analyze whether any of them may
Table 9.15 shows a small excerpt of the Florida data file at the text website. That file has data from all 67 Florida counties on crime rate (number of crimes per 1000 residents), median income (in thousands of dollars), percentage of residents with at least a high school education(of those aged at
The Guns suicide data file at the text website shows statewide data7 on y = suicides (per 100,000 people)and x = percentage of residents who own a firearm.Conduct a regression and correlation analysis to analyze the association.
Refer to the UN data file shown in Table 3.9 on page 65. Pose a research question relating to the association between fertility and the gender inequality index.Using software, analyze data in that file to address this question, and summarize your analyses.
Pose a research question about job satisfaction and educational attainment. Using the most recent GSS data on SATJOB and EDUC with the multiple regression option at sda.berkeley.edu/GSS, with scores (1, 2, 3, 4) for (very satisfied, . . . , very dissatisfied), conduct a descriptive and inferential
Refer to the data file you created in Exercise 1.12.For variables chosen by your instructor, pose a research question and conduct a regression and correlation analysis.Report both descriptive and inferential statistical analyses, interpreting and summarizing your findings.
For the Students data file (Exercise 1.11 on page 21), conduct regression analyses relating (i) y =political ideology and x = religiosity, (ii) y = high school GPA and x = hours of TV watching. Prepare a report(a) Using graphical ways of portraying the individual variables and their
For the OECD data file for OECD nations in Table 3.13 on page 70, use software to construct a scatterplot relating x = carbon dioxide emissions and y = prison population.(a) Based on this plot, identify a point that has a large influence in determining the correlation. Show how the correlation
In regression analysis, which of the following statements must be false? Why?(a) ryx1= 0.01, ryx2= −0.75, R = 0.2(b) The value of the residual sum of squares, SSE, can increase as we add additional variables to the model.(c) For the model E(y) = α + β1x1, y is significantly related to x1 at the
Refer to the previous exercise. When we regress political ideology in 2014 on x = number of hours spent in the home on religious activity in the past month(RELHRS1), we obtain------------------------------------------------B Std. Error Beta t Sig.Constant 4.0115 0.0422 95.10 0.0000 RELHRS1 0.0064
A study was conducted using 49 Catholic female undergraduates at Texas A&M University. The variables measured refer to the parents of these students. The response variable is the number of children that the parents have. One of the explanatory variables is the mother’s educational level, measured
For 2271 observations from the 2014 GSS on y =number of years of education (EDUC) and x = number of years of mother’s education (MAEDUC), ˆy =9.86 + 0.345x, with se = 0.0147 for the slope.(a) Test the null hypothesis that these variables are independent, and interpret.(b) Find a 95% confidence
Refer to the previous exercise. Now let the human development index (HDI) be the explanatory variable for predicting fertility. Using software with the UN data file at the text website,(a) Construct a scatterplot.Doany observations stand out as potential regression outliers?(b) Fit the model, and
Refer to Table 3.9 on page 65. This exercise uses y =fertility rate and x = gender inequality index. Table 9.13 shows part of an SPSS output for a regression analysis.(a) State a research question that could be addressed with this printout.(b) Report the prediction equation, and interpret.(c)
Refer to the Florida data file at the text website, shown partly in Table 9.15 for Exercise 9.39, giving countywide data for several variables in Florida. For those data, use software to analyze y = crime rate and x = percentage living in an urban environment.(a) Construct a box plot for y.
Refer to Table 9.1 and the Crime2 data file at the text website. For all 51 observations, use software to analyze the relationship between y = murder rate and x =poverty rate.(a) Construct a scatterplot. Does there seem to be a positive, or a negative, relationship?(b) Report the prediction
For data on several nations, we want to describe whether the percentage of people using the Internet is more strongly associated with per capita GDP or with the fertility rate.(a) Can we compare the slopes when GDP and fertility each predict Internet use in separate regression equations?Why or why
In the UN Human Development Report, one variable measured was x = percentage of adults who use contraceptive methods. Table 9.11 shows part of a regression analysis using y = fertility (mean number of children per adult woman), for 22 nations listed in that report. For those nations, x had a mean
For 2014 GSS data, the correlation matrix for subject’s education (EDUC), mother’s education (MAEDUC), and father’s education (PAEDUC) is EDUC PAEDUC MAEDUC EDUC 1.00 .46 .45 PAEDUC .46 1.00 .69 MAEDUC .45 .69 1.00 Interpret this matrix, identifying the pair of variables with the strongest
Access the Houses data file (shown partly in Table 9.5) at the text website. For the response variable taxes and explanatory variable size, using software,(a) Graphically portray the association, and describe it.(b) Find and interpret the prediction equation.(c) Find and interpret the correlation
The prediction equation relating x = years of education and y = annual income (in dollars) is ˆy = −20,000+4000x, and the correlation equals 0.50.The standard deviations were 2.0 for x and 16,000 for y.(a) Show how to find the correlation from the slope.(b) Results were translated to units of
For students who take Statistics 101 at Lake Wobegon College in Minnesota, both x = midterm exam score and y = final exam score have mean = 75 and standard deviation = 10.(a) The prediction equation is ˆy = 30 + 0.60x. Find the predicted final exam score for a student who has(i) midterm score =
For the study in Example 9.6 (page 270) of y = high school GPA and x = weekly number of hours viewing television, ˆy = 3.44 − 0.03x.(a) The study reported that r-squared = 0.237.Interpret.(b) Report and interpret the correlation.(c) Suppose you found the correlation only for those students
For the student survey data set described in Exercise 1.11, the sample correlation between y = political ideology(scored 1 to 7, with higher values representing more conservatism) and x = number of times a week reading a newspaper is r = −0.066.(a) Would you conclude that the sample association
The Internet site www.pearsonglobaleditions.com/Agresti has an Explore Linear Regression applet.To show the impact of an outlier, use the Draw Own option to put 10 points on the scatterplot that have a correlation close to +1, and then add a single point that changes the correlation to a negative
Table 9.15 in Exercise 9.39 shows countywide data for several variables in Florida. For those counties, Table 9.10 shows part of the output for the regression analysis relating y = median income (in thousands of dollars)to x = percentage of residents with at least a high school education.(a) Report
If ˆy = 2 + 3x1 + 5x2 − 8x3, then controlling for x2 and x3, the predicted mean change in y when x1 is increased from 10 to 20 equals(a) 3, (b) 30, (c) 0.3, (d) cannot be given—depends on specific values of x2 and x3.
A report summarizing the results of a study on the relationship between a verbal aptitude test x and a mathematics aptitude test y states that ¯x = 480, ¯y = 500, sx =80, sy = 120, and r = 0.60.Using the formulas for the correlation and for the least squares estimates, find the prediction
For nations listed in the Human Development Report, the correlation with percentage of people using the Internet is 0.888 for per capita gross domestic product(GDP, a summary description of a nation’s wealth), 0.818 for percentage using cell phones, 0.669 for literacy rate,−0.551 for fertility
In the 2000 Presidential election in the United States, the Democratic candidate was Al Gore and theRepublican candidate was George W. Bush. In Palm Beach County, Florida, initial election returns reported 3407 votes for the Reform party candidate, Pat Buchanan.Some political analysts thought that
Access the data file Crime2 shown in Table 9.1.Let y = violent crime rate and x = poverty rate.(a) Using software, show that the prediction equation isˆy = 209.9+25.5x. Interpret the y-intercept and the slope.(b) Find the predicted violent crime rate and the residual for Massachusetts, which had x
For the 2014 GSS, a prediction equation relates y =highest year of school completed to x = father’s highest year of school completed.(a) Which equation is more realistic for the result: ˆy =9.57 + 0.35x, or ˆy = 0.35 + 9.57x?Why?(b) Suppose the prediction equation had been ˆy = x.Identify the
Access the UN data file (shown in Table 3.9) at the text website from 42 countries. Let y = carbon dioxide emissions (metric tons per capita) and x = gross domestic product (per capita GDP, in dollars).(a) Find the prediction equation, and interpret the coefficients.(b) For the United States, x =
The Firearms data file at the text website shows U.S. statewide data on x = percentage of people who report owning a gun and y = firearm death rate (annual number of deaths per 100,000 population), from www.cdc.gov.(a) Find the prediction equation, and interpret.(b) The correlation is 0.70.Identify
Look at Figure 2 at http://ajph.aphapublica tions.org/doi/pdf/10.2105/AJPH.93.4.652, a scatterplot for U.S. states with correlation 0.53 between x = child poverty rate and y = child mortality rate.Approximate the y-intercept and slope of the prediction equation shown there.
The OECD (Organization for Economic Cooperation and Development) consists of advanced, industrialized countries. For these nations, a recent prediction equation6 relating y = child poverty rate to x = social expenditure as a percentage of gross domestic product isˆy = 22 − 1.3x. The y-values
If ˆy = 2 + 3x1 + 5x2 − 8x3,(a) The strongest correlation is between y and x3.(b) The variable with the strongest partial influence on y is x2.(c) The variable with the strongest partial influence on y is x3, but one cannot tell from this equation which pair has the strongest correlation.(d)
Anthropologists often try to reconstruct information using partial human remains at burial sites. For instance, after finding a femur (thighbone), they may want to predict how tall an individual was. An equation they use to do this is ˆy = 61.4 + 2.4x, where ˆy is the predicted height and x is
Sketch plots of the following prediction equations, for values of x between 0 and 10:(a) ˆy = 7 + x, (b) ˆy = 7 − x, (c) ˆy = 7, (d) ˆy = x.
For the following variables in a regression analysis, which variable more naturally plays the role of x (explanatory variable) and which plays the role of y (response variable)?(a) College grade point average (GPA) and high school GPA.(b) Number of children and mother’s education level.(c) Annual
8.46.* In an ordinal table, to calculate the number of concordant pairs C, start at the corner of the table for the low level for each variable. Multiply that cell count by the count in every cell that is higher on both variables. Similarly, for every other cell, multiply the cell count by the
8.44.* A chi-squared variable with degrees of freedom equal to df has representation z21 + · · · + z2 df, where z1, . . . , zdf are independent standard normal variates.(a) If z is a test statistic that has a standard normal distribution, what distribution does z2 have?(b) Explain how to get the
8.43.* Construct a 3×3 table for which gamma equals (a)1, (b) −1, (c) 0.
Showing 4100 - 4200
of 4976
First
35
36
37
38
39
40
41
42
43
44
45
46
47
48
49
Last
Step by Step Answers