

The accompanying table shows a portion of life expectancies (in years) and obesity rates (in %) for
Question:
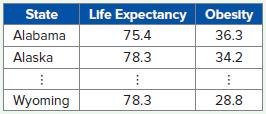
The accompanying table shows a portion of life expectancies (in years) and obesity rates (in %) for the 50 states and the District of Columbia. Construct a scatterplot of Life Expectancy against Obesity. Describe the relationship.
Fantastic news! We've Found the answer you've been seeking!
Step by Step Answer:
There appears to be a negative ...View the full answer

Answered By
Utsab mitra
I have the expertise to deliver these subjects to college and higher-level students. The services would involve only solving assignments, homework help, and others.
I have experience in delivering these subjects for the last 6 years on a freelancing basis in different companies around the globe. I am CMA certified and CGMA UK. I have professional experience of 18 years in the industry involved in the manufacturing company and IT implementation experience of over 12 years.
I have delivered this help to students effortlessly, which is essential to give the students a good grade in their studies.
2+ Reviews
10+ Question Solved
Related Book For 

Business Analytics Communicating With Numbers
ISBN: 9781260785005
1st Edition
Authors: Sanjiv Jaggia, Alison Kelly, Kevin Lertwachara, Leida Chen
Question Posted:
