New Semester
Started
Get
50% OFF
Study Help!
--h --m --s
Claim Now
Question Answers
Textbooks
Find textbooks, questions and answers
Oops, something went wrong!
Change your search query and then try again
S
Books
FREE
Study Help
Expert Questions
Accounting
General Management
Mathematics
Finance
Organizational Behaviour
Law
Physics
Operating System
Management Leadership
Sociology
Programming
Marketing
Database
Computer Network
Economics
Textbooks Solutions
Accounting
Managerial Accounting
Management Leadership
Cost Accounting
Statistics
Business Law
Corporate Finance
Finance
Economics
Auditing
Tutors
Online Tutors
Find a Tutor
Hire a Tutor
Become a Tutor
AI Tutor
AI Study Planner
NEW
Sell Books
Search
Search
Sign In
Register
study help
business
statistics econometrics
Biocalculus Calculus Probability And Statistics For The Life Sciences 1st Edition James Stewart, Troy Day - Solutions
f std − t 1 cot sty2d, f y4, 7 y4g Find the absolute maximum and absolute minimum values of f on the given interval.
f std − 2cos t 1 sin 2t, f0, y2g Find the absolute maximum and absolute minimum values of f on the given interval.
f sxd − x 2 2 tan21x, f0, 4g Find the absolute maximum and absolute minimum values of f on the given interval.
f sxd − lnsx2 1 x 1 1d, f21, 1g Find the absolute maximum and absolute minimum values of f on the given interval.
f sxd − x 2 ln x, f1 2 , 2g Find the absolute maximum and absolute minimum values of f on the given interval.
f sxd − xe2x2y8, f21, 4g Find the absolute maximum and absolute minimum values of f on the given interval.
f sxd −x2 2 4 x2 1 4, f24, 4g Find the absolute maximum and absolute minimum values of f on the given interval.
f std − ts4 2 t 2 , f21, 2g Find the absolute maximum and absolute minimum values of f on the given interval.
f sxd − sx2 2 1d3, f21, 2g Find the absolute maximum and absolute minimum values of f on the given interval.
f sxd − x4 2 2x2 1 3, f22, 3g Find the absolute maximum and absolute minimum values of f on the given interval.
f sxd − x3 2 6x2 1 9x 1 2, f21, 4g Find the absolute maximum and absolute minimum values of f on the given interval.
f sxd − 2x3 2 3x2 2 12x 1 1, f22, 3g Find the absolute maximum and absolute minimum values of f on the given interval.
f sxd − 5 1 54x 2 2x3, f0, 4g Find the absolute maximum and absolute minimum values of f on the given interval.
f sxd − 12 1 4x 2 x2, f0, 5g Find the absolute maximum and absolute minimum values of f on the given interval.
f s xd − x22 ln x Find the critical numbers of the function.
f sxd − x2e23x Find the critical numbers of the function.
hstd − 3t 2 arcsin t Find the critical numbers of the function.
f s d − 2 cos 1 sin2 Find the critical numbers of the function.
ts d − 4 2 tan Find the critical numbers of the function.
Fsxd − x4y5sx 2 4d2 Find the critical numbers of the function.
tsxd − x1y3 2 x22y3 Find the critical numbers of the function.
hstd − t 3y4 2 2t 1y4 Find the critical numbers of the function.
hspd −p 2 1 p2 1 4 Find the critical numbers of the function.
tsyd −y 2 1 y2 2 y 1 1 Find the critical numbers of the function.
tstd − |3t 2 4 |Find the critical numbers of the function.
sstd − 3t 4 1 4t 3 2 6t 2 Find the critical numbers of the function.
f sxd − x3 1 x2 1 x Find the critical numbers of the function.
f sxd − x3 1 3x2 2 24x Find the critical numbers of the function.
f sxd − x3 1 6x2 2 15x Find the critical numbers of the function.
f sxd − 4 1 13 x 2 12 x2 Find the critical numbers of the function.
f sxd − H4 2 x2 2x 2 1 if 22 < x , 0 if 0 < x < 2 Sketch the graph of f by hand and use your sketch to find the absolute and local maximum and minimum values off. (Use the graphs and transformations of Sections 1.2 and 1.3.)
f sxd − 1 2 sx Sketch the graph of f by hand and use your sketch to find the absolute and local maximum and minimum values off. (Use the graphs and transformations of Sections 1.2 and 1.3.)
f std − cos t, 23 y2 < t < 3 y2 Sketch the graph of f by hand and use your sketch to find the absolute and local maximum and minimum values off. (Use the graphs and transformations of Sections 1.2 and 1.3.)
f sxd − ln x, 0 , x < 2 Sketch the graph of f by hand and use your sketch to find the absolute and local maximum and minimum values off. (Use the graphs and transformations of Sections 1.2 and 1.3.)
f sxd − e x Sketch the graph of f by hand and use your sketch to find the absolute and local maximum and minimum values off. (Use the graphs and transformations of Sections 1.2 and 1.3.)
f sxd − x2, 0 , x , 2 Sketch the graph of f by hand and use your sketch to find the absolute and local maximum and minimum values off. (Use the graphs and transformations of Sections 1.2 and 1.3.)
f sxd − 2 2 13 x, x > 22 Sketch the graph of f by hand and use your sketch to find the absolute and local maximum and minimum values off. (Use the graphs and transformations of Sections 1.2 and 1.3.)
f sxd − 12 Sketch the graph of f by hand and use your sketch to find the absolute and local maximum and minimum values off. (Use the graphs and transformations of Sections 1.2 and 1.3.)s3x 2 1d, x < 3 Sketch the graph of f by hand and use your sketch to find the absolute and local maximum and
(a) Sketch the graph of a function that has two local maxima, one local minimum, and no absolute minimum.(b) Sketch the graph of a function that has three local minima, two local maxima, and seven critical numbers.
(a) Sketch the graph of a function on f21, 2g that has an absolute maximum but no absolute minimum.(b) Sketch the graph of a function on f21, 2g that is discontinuous but has both an absolute maximum and an absolute minimum.
(a) Sketch the graph of a function on f21, 2g that has an absolute maximum but no local maximum.(b) Sketch the graph of a function on f21, 2g that has a local maximum but no absolute maximum.
(a) Sketch the graph of a function that has a local maximum at 2 and is differentiable at 2.(b) Sketch the graph of a function that has a local maximum at 2 and is continuous but not differentiable at 2.(c) Sketch the graph of a function that has a local maximum at 2 and is not continuous at 2.
f has no local maximum or minimum, but 2 and 4 are critical numbers Sketch the graph of a function f that is continuous on [1, 5]and has the given properties
Absolute maximum at 5, absolute minimum at 2, local maximum at 3, local minima at 2 and 4 Sketch the graph of a function f that is continuous on [1, 5]and has the given properties
Absolute minimum at 1, absolute maximum at 5, local maximum at 2, local minimum at 4 Sketch the graph of a function f that is continuous on [1, 5]and has the given properties
Absolute minimum at 2, absolute maximum at 3, local minimum at 4 Sketch the graph of a function f that is continuous on [1, 5]and has the given properties
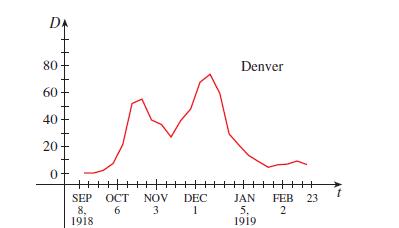
I nfluenza pandemic The study cited in Exercise 7 also included the corresponding graph for Denver shown here.(a) State the corresponding local and absolute maximum and minimum values for Denver.(b) Compare the graphs for New York and Denver. How do you think the strategies differed in the two
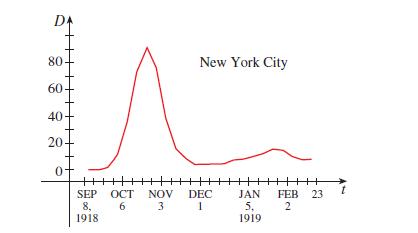
In the influenza pandemic of 1918–1919 about 40 million people died worldwide. A study in 2007 assessed the nonpharmaceutical interventions used in 43 US cities to combat the infection, including isolation, quarantines, school closures, and public gathering cancellations. The graph shows the
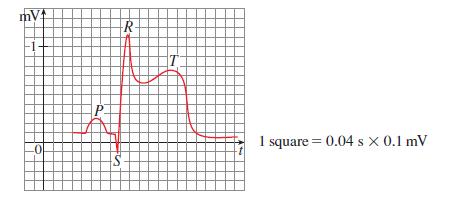
E lectrocardiogram A cardiologist looking at this rhythm strip might suspect infarction because of the elevation of the graph near S and T (compare with Figure 6). State the local and absolute maximum and minimum values of the electric potential function f std. mV R -1- 0 1 square 0.04 s x 0.1 mV
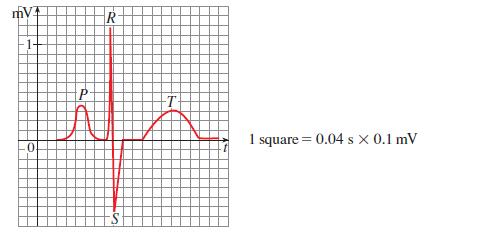
E lectrocardiogram A cardiologist looking at the rhythm strip shown might suspect right atrial hypertrophy because of the relatively tall peaked wave at P (compare with Figure 6). State the local and absolute maximum and minimum values of the electric potential function f std. mV R 1- 0 1 square =
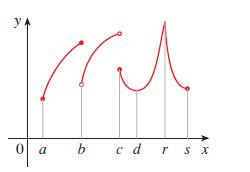
For each of the numbersa, b,c, d, r, and s, state whether the function whose graph is shown has an absolute maximum or minimum, a local maximum or minimum, or neither a maximum nor a minimum. 0 a b cd rsx
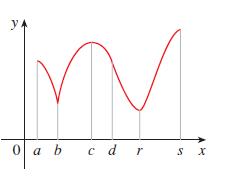
For each of the numbersa, b,c, d, r, and s, state whether the function whose graph is shown has an absolute maximum or minimum, a local maximum or minimum, or neither a maximum nor a minimum. y 0a b cd r x S
Suppose f is a continuous function defined on a closed interval fa, bg.(a) What theorem guarantees the existence of an absolute maximum value and an absolute minimum value for f ?(b) What steps would you take to find those maximum and minimum values?
Explain the difference between an absolute minimum and a local minimum.
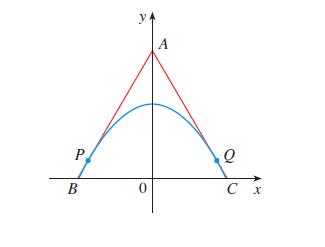
Find points P and Q on the parabola y − 1 2 x2 so that the triangle ABC formed by the x-axis and the tangent lines at P and Q is an equilateral triangle. P y A B 0 C x
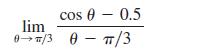
Express the limitas a derivative and thus evaluate it. cos 0-0.5 lim 0/30-/3
I nfectious disease outbreak size We have worked with the modelwhere A is the fraction of the population infected, q is a measure of disease transmissibility, and is the fraction of the population that is initially susceptible to infection.(a) Use implicit differentiation to find the linear
Dialysis The project on page 458 models the removal of urea from the bloodstream via dialysis. In certain situations the duration of dialysis required, given that the initial urea concentration isc, where c . 1, is given by the equation(a) Use a linear approximation to estimate the time required if
(a) Find the first three Taylor polynomials for f sxd − 4sx 2 2d22 centered at 0.; (b) Graph f and the Taylor polynomials from part (a) on the interval f21, 1g and comment on how well the polynomials approximate f .
(a) Find the linearization of f sxd − s3 1 1 3x at a − 0.State the corresponding linear approximation and use it to give an approximate value for s3 1.03 .; (b) Determine the values of x for which the linear approximation given in part (a) is accurate to within 0.1.
Use Newton’s method to find all roots of the equation sin x − x2 2 3x 1 1 correct to six decimal places.
Use Newton’s method to find the root of the equation x5 2 x4 1 3x2 2 3x 2 2 − 0 in the interval f1, 2g correct to six decimal places.
Yeast population The number of yeast cells in a laboratory culture increases rapidly initially but levels off eventually. The population is modeled by the function n − f std −a 1 1 be20.7t where t is measured in hours. At time t − 0 the population is 20 cells and is increasing at a rate of 12
The volume of a cube is increasing at a rate of 10 cm3ymin.How fast is the surface area increasing when the length of an edge is 30 cm?
A cup of hot chocolate has temperature 80°C in a room kept at 20°C. After half an hour the hot chocolate cools to 60°C.(a) What is the temperature of the chocolate after another half hour?(b) When will the chocolate have cooled to 408C?
Drug elimination Let Cstd be the concentration of a drug in the bloodstream. As the body eliminates the drug, Cstd decreases at a rate that is proportional to the amount of the drug that is present at the time. Thus C9std − 2kCstd, where k is a positive number called the elimination constant of
Cobalt-60 has a half-life of 5.24 years.(a) Find the mass that remains from a 100-mg sample after 20 years.(b) How long would it take for the mass to decay to 1 mg?
Bacteria growth A bacteria culture contains 200 cells initially and grows at a rate proportional to its size. After half an hour the population has increased to 360 cells.(a) Find the number of bacteria after t hours.(b) Find the number of bacteria after 4 hours.(c) Find the rate of growth after 4
Drug concentration The function Cstd − Kse2at 2 e2bt d, wherea, b, and K are positive constants and b .a, is used to model the concentration at time t of a drug injected into the bloodstream.(a) Show that limt l ` Cstd − 0.(b) Find C9std, the rate of change of drug concentration in the
H ealth care expenditures The US health care expenditures for 1970–2008 have been modeled by the function Estd − 101.35e0.088128t where t is the number of years elapsed since 1970 and E is measured in billions of dollars. According to this model, at what rate were health care expenditures
The Michaelis-Menten equation for the enzyme pepsin is v −0.50fSg 3.0 3 1024 1 fSg where v is the rate of an enzymatic reaction and fSg is the concentration of a substrate S. Calculate dvydfSg and interpret it.
The volume of a right circular cone is V − 13 r 2h, where r is the radius of the base and h is the height.(a) Find the rate of change of the volume with respect to the height if the radius is constant.(b) Find the rate of change of the volume with respect to the radius if the height is constant.
A particle moves along a horizontal line so that its coordinate at time t is x − sb2 1 c2t 2 , t > 0, where b and c are positive constants.(a) Find the velocity and acceleration functions.(b) Show that the particle always moves in the positive direction.
An equation of motion of the form s − Ae2ct coss t 1 d represents damped oscillation of an object. Find the velocity and acceleration of the object.
Find a parabola y − ax2 1 bx 1 c that passes through the point s1, 4d and whose tangent lines at x − 21 and x − 5 have slopes 6 and 22, respectively.
Find the points on the ellipse x2 1 2y2 − 1 where the tangent line has slope 1.
(a) Find an equation of the tangent to the curve y − ex that is parallel to the line x 2 4y − 1.(b) Find an equation of the tangent to the curve y − ex that passes through the origin.
At what point on the curve y − flnsx 1 4dg2 is the tangent horizontal?
f sxd − tsln xd Find f 9 in terms of t9.
f sxd − ln |tsxd |Find f 9 in terms of t9.
f sxd − etsxd Find f 9 in terms of t9.
f sxd − tsex d Find f 9 in terms of t9.
f sxd − ts tsxdd Find f 9 in terms of t9.
f sxd − f tsxdg2 Find f 9 in terms of t9.
f sxd − tsx2 d Find f 9 in terms of t9.
f sxd − x2tsxd Find f 9 in terms of t9.
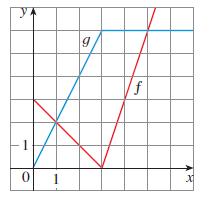
If f and t are the functions whose graphs are shown, let Psxd − f sxd tsxd, Qsxd − f sxdytsxd, and Csxd − f s tsxdd.Find (a) P9s2d, (b) Q9s2d, and (c) C9s2d. y g f 0 1 x
Suppose that hsxd − f sxd tsxd and Fsxd − f s tsxdd, where f s2d − 3, ts2d − 5, t9s2d − 4, f 9s2d − 22, and f 9s5d − 11.Find (a) h9s2d and (b) F9s2d.
(a) Graph the function f sxd − x 2 2 sin x in the viewing rectangle f0, 8g by f22, 8g.(b) On which interval is the average rate of change larger:f1, 2g or f2, 3g?(c) At which value of x is the instantaneous rate of change larger: x − 2 or x − 5?(d) Check your visual estimates in part (c) by
(a) If f sxd − xs5 2 x , find f 9sxd.(b) Find equations of the tangent lines to the curve y − xs5 2 x at the points s1, 2d and s4, 4d.(c) Illustrate part (b) by graphing the curve and tangent lines on the same screen.; (d) Check to see that your answer to part (a) is reasonable by comparing the
x2 1 4xy 1 y2 − 13, s2, 1d Find equations of the tangent line and normal line to the curve at the given point.
y − s2 1 xde2x, s0, 2d Find equations of the tangent line and normal line to the curve at the given point.
y −x2 2 1 x2 1 1, s0, 21d Find an equation of the tangent to the curve at the given point.
y − 4 sin2x, s y6, 1d Find an equation of the tangent to the curve at the given point.
Find f sndsxd if f sxd − 1ys2 2 xd.
If f sxd − 2x, find f sndsxd.
If ts d − sin , find t99s y6d.
If f std − s4t 1 1, find f 99s2d.
y − sin2scosssin x d Calculate y9.
y − cos(estan 3x )Calculate y9.
Showing 1000 - 1100
of 7357
First
4
5
6
7
8
9
10
11
12
13
14
15
16
17
18
Last
Step by Step Answers