New Semester
Started
Get
50% OFF
Study Help!
--h --m --s
Claim Now
Question Answers
Textbooks
Find textbooks, questions and answers
Oops, something went wrong!
Change your search query and then try again
S
Books
FREE
Study Help
Expert Questions
Accounting
General Management
Mathematics
Finance
Organizational Behaviour
Law
Physics
Operating System
Management Leadership
Sociology
Programming
Marketing
Database
Computer Network
Economics
Textbooks Solutions
Accounting
Managerial Accounting
Management Leadership
Cost Accounting
Statistics
Business Law
Corporate Finance
Finance
Economics
Auditing
Tutors
Online Tutors
Find a Tutor
Hire a Tutor
Become a Tutor
AI Tutor
AI Study Planner
NEW
Sell Books
Search
Search
Sign In
Register
study help
business
statistics econometrics
Biocalculus Calculus Probability And Statistics For The Life Sciences 1st Edition James Stewart, Troy Day - Solutions
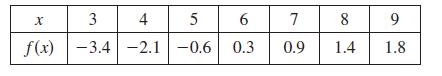
The table gives the values of a function obtained from an experiment. Use them to estimate y9 3 f sxd dx using three equal subintervals with (a) right endpoints, (b) left end-points, and (c) midpoints. If the function is known to be an increasing function, can you say whether your estimates are
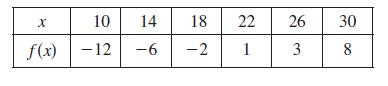
A table of values of an increasing function f is shown. Use the table to find lower and upper estimates for y30 10 f sxd dx. x 10 14 18 22 26 30 f(x) -12 -6 -2 1 3 8
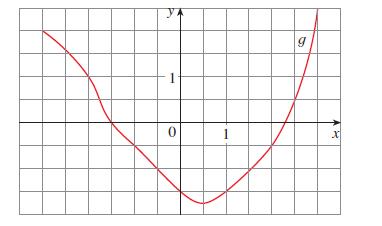
The graph of t is shown. Estimate y3 23 tsxd dx with six subintervals using (a) right endpoints, (b) left endpoints, and (c) midpoints. y g 0 X
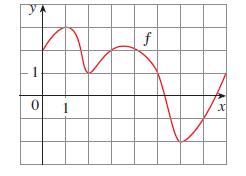
The graph of a function f is given. Estimate y8 0 f sxd dx using four subintervals with (a) right endpoints, (b) left endpoints, and (c) midpoints. 1 f 0 1 X
(a) Find the Riemann sum for f sxd − sin x, 0 < x < 3 y2, with six terms, taking the sample points to be right endpoints. (Give your answer correct to six decimal places.) Explain what the Riemann sum represents with the aid of a sketch.(b) Repeat part (a) with midpoints as the sample points.
If f sxd − ex 2 2, 0 < x < 2, find the Riemann sum with n − 4 correct to six decimal places, taking the sample points to be midpoints. What does the Riemann sum represent? Illustrate with a diagram.
If f sxd − x2 2 2x, 0 < x < 3, evaluate the Riemann sum with n − 6, taking the sample points to be right endpoints.What does the Riemann sum represent? Illustrate with a diagram.
Evaluate the Riemann sum for f sxd − 3 2 12 x, 2 < x < 14, with six subintervals, taking the sample points to be left endpoints. Explain, with the aid of a diagram, what the Riemann sum represents.
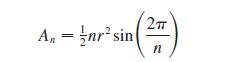
(a) Let An be the area of a polygon with n equal sides inscribed in a circle with radius r. By dividing the polygon into n congruent triangles with central angle 2yn, show that(b) Show that limn l ` An − r 2. [Hint: Use Equation 2.4.6 on page 133.] Anr sin = 2T n
Find the exact area under the cosine curve y − cos x from x − 0 to x −b, where 0 < b < y2. (Use a computer algebra system both to evaluate the sum and compute the limit.) In particular, what is the area if b − y2?
Find the exact area of the region under the graph of y − e2x from 0 to 2 by using a computer algebra system to evaluate the sum and then the limit in Example 3(a).Compare your answer with the estimate obtained in Example 3(b).
(a) Express the area under the curve y − x5 from 0 to 2 as a limit.(b) Use a computer algebra system to find the sum in your expression from part (a).(c) Evaluate the limit in part (a).
If A is the area under the curve y − ex from 1 to 3, use Exercise 19 to find a value of n such that Rn 2 A , 0.0001.
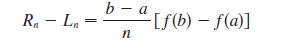
Let A be the area under the graph of an increasing continuous function f from a tob, and let Ln and Rn be the approximations to A with n subintervals using left and right endpoints, respectively.(a) How are A, Ln, and Rn related?(b) Show that(c) Deduce that b-a Rn - Ln = [f(b) - f(a)] n
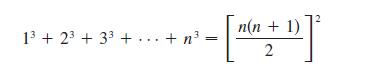
(a) Use Definition 2 to find an expression for the area under the curve y − x3 from 0 to 1 as a limit.(b) The following formula for the sum of the cubes of the first n integers is proved in Appendix E. Use it to evaluate the limit in part (a). 13+23+33 + ... + n == n(n + 1) 2 2
f sxd − x cos x, 0 < x < y2 Use Definition 2 to find an expression for the area under the graph of f as a limit. Do not evaluate the limit.
f sxd − x2 1 s1 1 2x , 4 < x < 7 Use Definition 2 to find an expression for the area under the graph of f as a limit. Do not evaluate the limit.
f sxd −2x x2 1 1, 1 < x < 3 Use Definition 2 to find an expression for the area under the graph of f as a limit. Do not evaluate the limit.
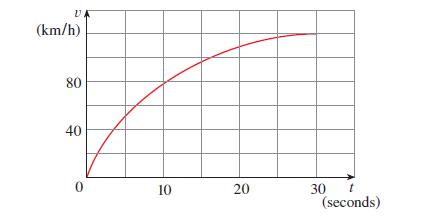
The velocity graph of a car accelerating from rest to a speed of 120 kmyh over a period of 30 seconds is shown. Estimate the distance traveled during this period. (km/h) 80 40 0 10 20 20 30 t (seconds)
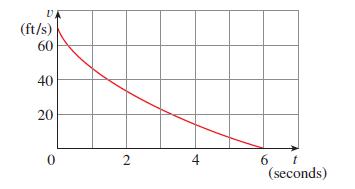
The velocity graph of a braking car is shown. Use it to estimate the distance traveled by the car while the brakes are applied. V (ft/s) 60 2 200 40 20 0 2 4 6 t (seconds)
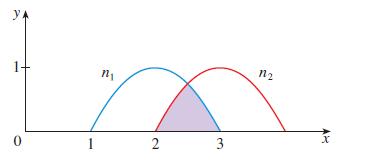
Niche overlap The extent to which species compete for resources is often measured by the niche overlap. If the horizontal axis represents a continuum of different resource types (for example, seed sizes for certain bird species), then a plot of the degree of preference for these resources is called
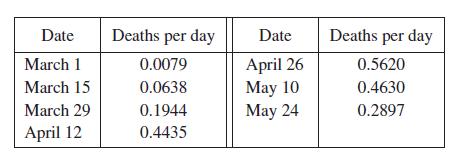
SARS incidence The table shows the number of people per day who died from SARS in Singapore at two-week intervals beginning on March 1, 2003.Estimate the number of people who died of SARS in Singapore between March 1 and May 24, 2003, using both left endpoints and right endpoints. Date Deaths per
Measles pathogenesis If a patient has had previous exposure to measles, the immune system responds more quickly. This results in a suppression of the level of virus in the plasma during an infection. Suppose that such previous exposure causes the viral density in the plasma to be 35 of that in a
Measles pathogenesis The function f std − 2tst 2 21dst 1 1d can be used to model the measles pathogenesis curve in Figures 17 and 19. Suppose symptoms appear after 12 days.Use six subintervals and their midpoints to estimate the total amount of infection needed to develop symptoms.
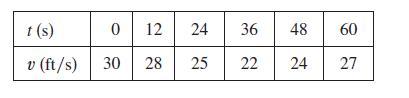
Speedometer readings for a motorcycle at 12-second intervals are given in the table.(a) Estimate the distance traveled by the motorcycle during this time period using the velocities at the beginning of the time intervals.(b) Give another estimate using the velocities at the end of the time
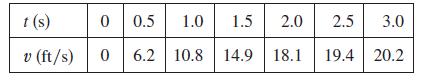
The speed of a runner increased steadily during the first three seconds of a race. Her speed at half-second intervals is given in the table. Find lower and upper estimates for the distance that she traveled during these three seconds. t(s) 0 0.5 1.0 1.5 2.0 2.5 3.0 06 v (ft/s) 0 6.2 10.8 14.9 18.1
(a) Graph the function f sxd − x 2 2 ln x 1 < x < 5(b) Estimate the area under the graph of f using four approximating rectangles and taking the sample points to be (i) right endpoints and (ii) midpoints. In each case sketch the curve and the rectangles.(c) Improve your estimates in part (b) by
(a) Estimate the area under the graph of f sxd − 1 1 x2 from x − 21 to x − 2 using three rectangles and right endpoints. Then improve your estimate by using six rectangles.Sketch the curve and the approximating rectangles.(b) Repeat part (a) using left endpoints.(c) Repeat part (a) using
(a) Estimate the area under the graph of f sxd − sx from x − 0 to x − 4 using four approximating rectangles and right endpoints. Sketch the graph and the rectangles. Is your estimate an underestimate or an overestimate?(b) Repeat part (a) using left endpoints.
(a) Estimate the area under the graph of f sxd − cos x from x − 0 to x − y2 using four approximating rectangles and right endpoints. Sketch the graph and the rectangles.Is your estimate an underestimate or an overestimate?(b) Repeat part (a) using left endpoints.
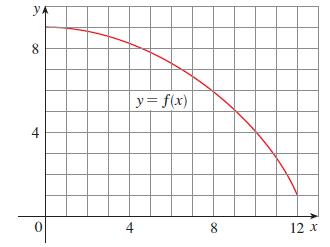
(a) Use six rectangles to find estimates of each type for the area under the given graph of f from x − 0 to x − 12.(i) L6 (sample points are left endpoints)(ii) R6 (sample points are right endpoints)(iii) M6 (sample points are midpoints)(b) Is L6 an underestimate or overestimate of the true
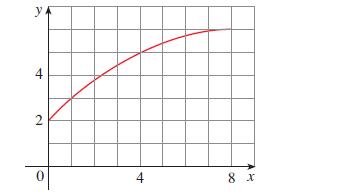
(a) By reading values from the given graph off, use four rectangles to find a lower estimate and an upper estimate for the area under the given graph of f from x − 0 to x − 8. In each case sketch the rectangles that you use.(b) Find new estimates using eight rectangles in each case. y 4 2 0 4 8
lim xl 0 e4x 2 1 2 4x x2 Evaluate the limit.
lim xl0 1 2 cos x x2 1 x Evaluate the limit.
lim xl0 tan x lns1 1 xd Evaluate the limit.
Sketch the graph of a function that satisfies the following conditions:f s0d − 0, f is continuous and even, f 9sxd − 2x if 0 , x , 1, f 9sxd − 21 if 1 , x , 3, f 9sxd − 1 if x . 3
P opulation bound Suppose that an initial population size is 300 individuals and the population grows at a rate of at most 120 individuals per week. What can you say about the population size after five weeks?
Drug pharmacokinetics Another model for the concentration of a drug in the bloodstream is Cstd − 0.5t 2e20.6t where t is measured in hours and C is measured in mgymL.(a) At what time does the concentration have its largest value? What is the largest value?(b) How many inflection points are there?
A ntibiotic pharmacokinetics A model for the concentration of an antibiotic drug in the bloodstream t hours after the administration of the drug is Cstd − 2.5se20.3t 2 e20.7td where C is measured in mgymL.(a) At what time does the concentration have its maximum value? What is the maximum
y − lnsx2 2 1d(a) Find the vertical and horizontal asymptotes, if any.(b) Find the intervals of increase or decrease.(c) Find the local maximum and minimum values.(d) Find the intervals of concavity and the inflection points.(e) Use the information from parts (a)–(d) to sketch the graph off.
y − ex 1 e23x(a) Find the vertical and horizontal asymptotes, if any.(b) Find the intervals of increase or decrease.(c) Find the local maximum and minimum values.(d) Find the intervals of concavity and the inflection points.(e) Use the information from parts (a)–(d) to sketch the graph off.
y − e2x2x2(a) Find the vertical and horizontal asymptotes, if any.(b) Find the intervals of increase or decrease.(c) Find the local maximum and minimum values.(d) Find the intervals of concavity and the inflection points.(e) Use the information from parts (a)–(d) to sketch the graph off. Check
y − sin2 x 2 2 cos x(a) Find the vertical and horizontal asymptotes, if any.(b) Find the intervals of increase or decrease.(c) Find the local maximum and minimum values.(d) Find the intervals of concavity and the inflection points.(e) Use the information from parts (a)–(d) to sketch the graph
f sxd −1 1 2 x2(a) Find the vertical and horizontal asymptotes, if any.(b) Find the intervals of increase or decrease.(c) Find the local maximum and minimum values.(d) Find the intervals of concavity and the inflection points.(e) Use the information from parts (a)–(d) to sketch the graph off.
f sxd − x 1 s1 2 x(a) Find the vertical and horizontal asymptotes, if any.(b) Find the intervals of increase or decrease.(c) Find the local maximum and minimum values.(d) Find the intervals of concavity and the inflection points.(e) Use the information from parts (a)–(d) to sketch the graph
f sxd − x4 1 4x3(a) Find the vertical and horizontal asymptotes, if any.(b) Find the intervals of increase or decrease.(c) Find the local maximum and minimum values.(d) Find the intervals of concavity and the inflection points.(e) Use the information from parts (a)–(d) to sketch the graph off.
f sxd − 2 2 2x 2 x3(a) Find the vertical and horizontal asymptotes, if any.(b) Find the intervals of increase or decrease.(c) Find the local maximum and minimum values.(d) Find the intervals of concavity and the inflection points.(e) Use the information from parts (a)–(d) to sketch the graph
f sxd − sln xdyx2, f1, 3g Find the local and absolute extreme values of the function on the given interval.
f sxd − x 1 sin 2x, f0, g Find the local and absolute extreme values of the function on the given interval.
f sxd − sx2 1 2xd3, f22, 1g Find the local and absolute extreme values of the function on the given interval.
f sxd −3x 2 4 x2 1 1, f22, 2g Find the local and absolute extreme values of the function on the given interval.
f sxd − xs1 2 x , f21, 1g Find the local and absolute extreme values of the function on the given interval.
f sxd − x3 2 6x2 1 9x 1 1, f2, 4g Find the local and absolute extreme values of the function on the given interval.
lim x l 0 xex − 1 Determine whether the statement is true or false. If it is true, explain why. If it is false, explain why or give an example that disproves the statement.
If f is periodic, then f 9 is periodic.Determine whether the statement is true or false. If it is true, explain why. If it is false, explain why or give an example that disproves the statement.
If f is even, then f 9 is even.Determine whether the statement is true or false. If it is true, explain why. If it is false, explain why or give an example that disproves the statement.
If f is increasing and f sxd . 0 on I, then tsxd − 1yf sxd is decreasing on I.Determine whether the statement is true or false. If it is true, explain why. If it is false, explain why or give an example that disproves the statement.
If f and t are positive increasing functions on an interval I, then f t is increasing on I.Determine whether the statement is true or false. If it is true, explain why. If it is false, explain why or give an example that disproves the statement.
If f and t are increasing on an interval I, then f t is increasing on I.Determine whether the statement is true or false. If it is true, explain why. If it is false, explain why or give an example that disproves the statement.
If f and t are increasing on an interval I, then f 2 t is increasing on I.Determine whether the statement is true or false. If it is true, explain why. If it is false, explain why or give an example that disproves the statement.
If f and t are increasing on an interval I, then f 1 t is increasing on I.Determine whether the statement is true or false. If it is true, explain why. If it is false, explain why or give an example that disproves the statement.
There exists a function f such that f sxd , 0, f 9sxd , 0, and f 0 sxd . 0 for all x.Determine whether the statement is true or false. If it is true, explain why. If it is false, explain why or give an example that disproves the statement.
There exists a function f such that f sxd . 0, f 9sxd , 0, and f 0 sxd . 0 for all x.Determine whether the statement is true or false. If it is true, explain why. If it is false, explain why or give an example that disproves the statement.
There exists a function f such that f s1d − 22, f s3d − 0, and f 9sxd . 1 for all x.Determine whether the statement is true or false. If it is true, explain why. If it is false, explain why or give an example that disproves the statement.
If f 9sxd − t9sxd for 0 , x , 1, then f sxd − tsxd for 0 , x , 1.Determine whether the statement is true or false. If it is true, explain why. If it is false, explain why or give an example that disproves the statement.
If f 0s2d − 0, then s2, f s2dd is an inflection point of the curve y − f sxd.Determine whether the statement is true or false. If it is true, explain why. If it is false, explain why or give an example that disproves the statement.
If f 9sxd , 0 for 1 , x , 6, then f is decreasing on (1, 6).Determine whether the statement is true or false. If it is true, explain why. If it is false, explain why or give an example that disproves the statement.
If f is differentiable and f s21d − f s1d, then there is a number c such that |c | , 1 and f 9scd − 0.Determine whether the statement is true or false. If it is true, explain why. If it is false, explain why or give an example that disproves the statement.
If f is continuous on sa, bd, then f attains an absolute maximum value f scd and an absolute minimum value f sdd at some numbers c and d in sa, bd.Determine whether the statement is true or false. If it is true, explain why. If it is false, explain why or give an example that disproves the
If f has an absolute minimum value atc, then f 9scd − 0.Determine whether the statement is true or false. If it is true, explain why. If it is false, explain why or give an example that disproves the statement.
If f 9scd − 0, then f has a local maximum or minimum at c.Determine whether the statement is true or false. If it is true, explain why. If it is false, explain why or give an example that disproves the statement.
(a) What is an equilibrium of the recursive sequence xt11 − f sxtd?(b) What is a stable equilibrium? An unstable equilibrium?(c) State the Stability Criterion.
(a) What does l’Hospital’s Rule say?(b) How can you use l’Hospital’s Rule if you have a product f sxd tsxd where f sxd l 0 and tsxd l ` as x l a?(c) How can you use l’Hospital’s Rule if you have a difference f sxd 2 tsxd where f sxd l ` and tsxd l ` as x l a?
State the Mean Value Theorem and give a geometric interpretation.
Find a function f such that f 9sxd − x3 and the line x 1 y − 0 is tangent to the graph of f.
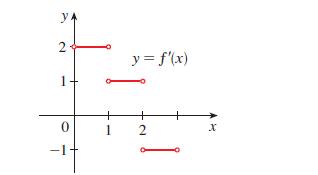
The graph of f 9 is shown in the figure. Sketch the graph of f if f is continuous on f0, 3g and f s0d − 21. 2 1 y= f'(x) + 0 2 x -1
To prove Theorem 1, let F and G be any two antiderivatives of f on I and let H − G 2 F.(a) If x1 and x2 are any two numbers in I with x1 , x2, apply the Mean Value Theorem on the interval fx1, x2g to show that Hsx1d − Hsx2d. Why does this show that H is a constant function?(b) Deduce Theorem 1
A stone is dropped from the upper observation deck (the Space Deck) of the CN Tower, 450 m above the ground.(a) Find the distance of the stone above ground level at time t. Use the fact that acceleration due to gravity is t < 9.8 mys2.(b) How long does it take the stone to reach the ground?(c) With
A particle moves with acceleration function astd − 5 1 4t 2 2t 2. Its initial velocity is vs0d − 3 mys and its initial displacement is ss0d − 10 m. Find its position after t seconds.
A particle moves along a straight line with velocity function vstd − sin t 2 cos t and its initial displacement is ss0d − 0 m.Find its position function sstd.
A sample of cesium-37 with an initial mass of 75 mg decays t years later at a rate of 1.7325e20.0231t mgyyear. Find the mass of the sample after 20 years.
Bacteria culture A culture of the bacterium Rhodobacter sphaeroides initially has 25 bacteria and t hours later increases at a rate of 3.4657e0.1386t bacteria per hour. Find the population size after four hours.
f 0std − 2et 1 3 sin t, f s0d − 0, f s d − 0 Find f .
f 0sxd − 2 2 12x, f s0d − 9, f s2d − 15 Find f .
f 0sxd − 8x3 1 5, f s1d − 0, f 9s1d − 8 Find f .
f 0s d − sin 1 cos , f s0d − 3, f 9s0d − 4 Find f .
f 9sxd − 2x 2 3yx4, x . 0, f s1d − 3 Find f .
f 9sxd − sx s6 1 5xd, f s1d − 10 Find f .
f 9sxd − 8x3 1 12x 1 3, f s1d − 6 Find f .
f 9sxd − 1 2 6x, f s0d − 8 Find f .
f 0sxd − 6x 1 sin x Find f .
f 0sxd − 23 x2y3 Find f .
f 0sxd − 2 1 x3 1 x6 Find f .
f 0sxd − 6x 1 12x2 Find f .
f sxd −1 1 x 2 x2 xFind the most general antiderivative of the function.(Check your answer by differentiation.)==21.dy dt − t 2 1 1, t > 0, y − 6 when t − 0 Solve the initial-value problem.==22.dy dt − 1 1 2 t , t . 0, y − 5 when t − 1 Solve the initial-value problem.==23.dP dt −
f std −t 4 2 t 2 1 1 t 2 Find the most general antiderivative of the function.(Check your answer by differentiation.)
f sxd − 3ex 1 7 sec2x Find the most general antiderivative of the function.(Check your answer by differentiation.)
f sud −u4 1 3su u2 Find the most general antiderivative of the function.(Check your answer by differentiation.)
usrd − e22r Find the most general antiderivative of the function.(Check your answer by differentiation.)
vssd − 4s 1 3es Find the most general antiderivative of the function.(Check your answer by differentiation.)
Showing 700 - 800
of 7357
1
2
3
4
5
6
7
8
9
10
11
12
13
14
15
Last
Step by Step Answers