New Semester
Started
Get
50% OFF
Study Help!
--h --m --s
Claim Now
Question Answers
Textbooks
Find textbooks, questions and answers
Oops, something went wrong!
Change your search query and then try again
S
Books
FREE
Study Help
Expert Questions
Accounting
General Management
Mathematics
Finance
Organizational Behaviour
Law
Physics
Operating System
Management Leadership
Sociology
Programming
Marketing
Database
Computer Network
Economics
Textbooks Solutions
Accounting
Managerial Accounting
Management Leadership
Cost Accounting
Statistics
Business Law
Corporate Finance
Finance
Economics
Auditing
Tutors
Online Tutors
Find a Tutor
Hire a Tutor
Become a Tutor
AI Tutor
AI Study Planner
NEW
Sell Books
Search
Search
Sign In
Register
study help
business
statistics econometrics
Biocalculus Calculus Probability And Statistics For The Life Sciences 1st Edition James Stewart, Troy Day - Solutions
tstd − 2t23y4 Differentiate the function.
Bs yd − cy26 Differentiate the function.
Assd − 2 12 s 5 Differentiate the function.
hsxd − sx 2 2ds2x 1 3d Differentiate the function.
f std − 14 st 4 1 8d Differentiate the function.
y − sin t 1 cos t Differentiate the function.
f sxd − x 2 3 sin x Differentiate the function.
f std − 12 t 6 2 3t 4 1 t Differentiate the function.
f sxd − x3 2 4x 1 6 Differentiate the function.
Fsxd − 34 x8 Differentiate the function.
f sxd − 5x 2 1 Differentiate the function.
f sxd − s30 Differentiate the function.
f sxd − 186.5 Differentiate the function.
(a) Sketch, by hand, the graph of the function f sxd − ex, paying particular attention to how the graph crosses the y-axis. What fact allows you to do this?(b) What types of functions are f sxd − ex and tsxd − xe ?Compare the differentiation formulas for f and t.(c) Which of the two functions
(a) How is the number e defined?(b) Use a calculator to estimate the values of the limits lim h l 0 2.7h 2 1 hand lim h l 0 2.8h 2 1 hcorrect to two decimal places. What can you conclude about the value of e?
When you turn on a hot-water faucet, the temperature T of the water depends on how long the water has been running.(a) Sketch a possible graph of T as a function of the time t that has elapsed since the faucet was turned on.(b) Describe how the rate of change of T with respect to t varies as t
Recall that a function f is called even if f s2xd − f sxd for all x in its domain and odd if f s2xd − 2f sxd for all such x.Prove each of the following.(a) The derivative of an even function is an odd function.(b) The derivative of an odd function is an even function.
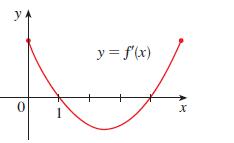
f sxd − x3 2 3x Use the definition of a derivative to find f 9sxd and f 0sxd. Then graph f , f 9, and f 0 on a common screen and check to see if your answers are reasonable.47. The graph of the derivative f 9 of a function f is shown.(a) On what intervals is f increasing?(b) If it is known that f
f sxd − 3x2 1 2x 1 1 Use the definition of a derivative to find f 9sxd and f 0sxd. Then graph f , f 9, and f 0 on a common screen and check to see if your answers are reasonable.
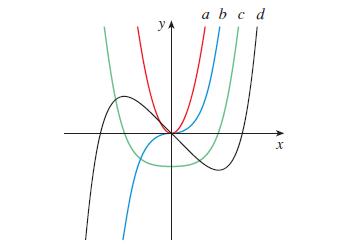
The figure shows graphs off, f 9, f 0, and f -. Identify each curve, and explain your choices. y. a b c d X
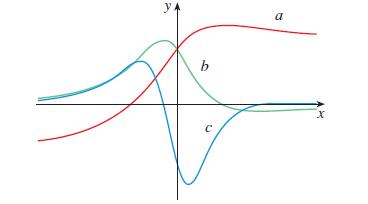
The figure shows the graphs of f , f 9, and f 0. Identify each curve, and explain your choices. y b a C x
Zoom in toward the points (1, 0), (0, 1), and s21, 0d on the graph of the function tsxd − sx2 2 1d2y3. What do you notice? Account for what you see in terms of the differentiability of t.
Graph the function f sxd − x 1 s|x | . Zoom in repeatedly, first toward the point s21, 0d and then toward the origin.What is different about the behavior of f in the vicinity of these two points? What do you conclude about the differentiability of f ?
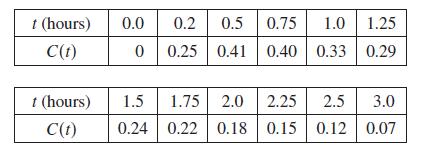
Blood alcohol concentration Researchers measured the blood alcohol concentration Cstd of eight adult male subjects after rapid consumption of 30 mL of ethanol (corresponding to two standard alcoholic drinks). The table shows the data they obtained by averaging the BAC (in mgymL) of the eight
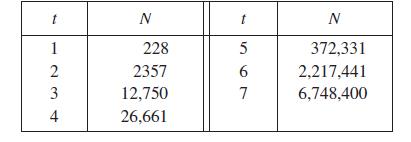
Malarial parasites An experiment measured the number of malarial parasites Nstd per microliter of blood, where t is measured in days. The results of the experiment are shown in the table.(a) What is the meaning of N9std? What are its units?(b) Construct a table of estimated values for N9std.[See
f std − t 2 2 st(a) Use the definition of the derivative to calculate f 9.(b) Check to see that your answer is reasonable by comparing the graphs of f and f 9.
f sxd − x4 1 2x(a) Use the definition of the derivative to calculate f 9.(b) Check to see that your answer is reasonable by comparing the graphs of f and f 9.
f sxd − x 1 1yx(a) Use the definition of the derivative to calculate f 9.(b) Check to see that your answer is reasonable by comparing the graphs of f and f 9.
f sxd − x4 Find the derivative of the function using the definition of a derivative. State the domain of the function and the domain of its derivative.
tstd −1 st Find the derivative of the function using the definition of a derivative. State the domain of the function and the domain of its derivative.
Gstd −4t t 1 1 Find the derivative of the function using the definition of a derivative. State the domain of the function and the domain of its derivative.
tsxd − s1 1 2x 28. f sxd −x 2 2 1 2x 2 3 Find the derivative of the function using the definition of a derivative. State the domain of the function and the domain of its derivative.
f sxd − x2 2 2x3 26. f sxd − x 1 sx Find the derivative of the function using the definition of a derivative. State the domain of the function and the domain of its derivative.
f std − 5t 2 9t 2 24. f sxd − 1.5x2 2 x 1 3.7 Find the derivative of the function using the definition of a derivative. State the domain of the function and the domain of its derivative.
f sxd − mx 1 b Find the derivative of the function using the definition of a derivative. State the domain of the function and the domain of its derivative.
f sxd − 12 x 2 13 Find the derivative of the function using the definition of a derivative. State the domain of the function and the domain of its derivative.
Let f sxd − x3.(a) Estimate the values of f 9s0d, f 9(12), f 9s1d, f 9s2d, and f 9s3d by using a graphing device to zoom in on the graph of f .(b) Use symmetry to deduce the values of f 9(21 2 ), f 9s21d, f 9s22d, and f 9s23d.(c) Use the values from parts (a) and (b) to graph f 9.(d) Guess a
Let f sxd − x2.(a) Estimate the values of f 9s0d, f 9(12), f 9s1d, and f 9s2d by using a graphing device to zoom in on the graph of f .(b) Use symmetry to deduce the values of f 9(21 2 ), f 9s21d, and f 9s22d.(c) Use the results from parts (a) and (b) to guess a formula for f 9sxd.(d) Use the
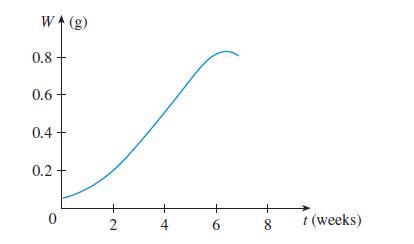
Yeast population Shown is the graph of the population function Pstd for yeast cells in a laboratory culture. Use the method of Example 1 to graph the derivative P9std. What does the graph of P9 tell us about the yeast population?13. T adpole weights The graph shows the average body weight W as a
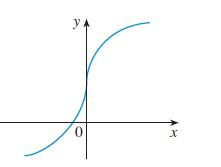
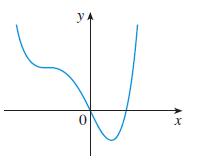
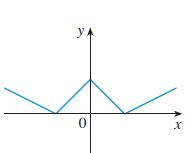
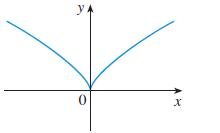
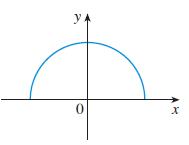
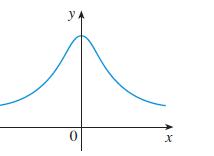
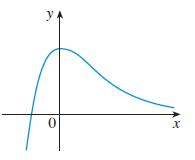
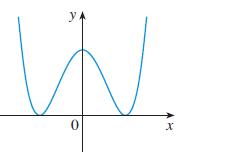
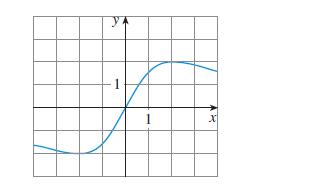
Trace or copy the graph of the given function f . (Assume that the axes have equal scales.) Then use the method of Example 1 to sketch the graph of f 9 below it. 0 Xx
Trace or copy the graph of the given function f . (Assume that the axes have equal scales.) Then use the method of Example 1 to sketch the graph of f 9 below it. x 0 4
Trace or copy the graph of the given function f . (Assume that the axes have equal scales.) Then use the method of Example 1 to sketch the graph of f 9 below it. x 0
Trace or copy the graph of the given function f . (Assume that the axes have equal scales.) Then use the method of Example 1 to sketch the graph of f 9 below it. 0 x
Trace or copy the graph of the given function f . (Assume that the axes have equal scales.) Then use the method of Example 1 to sketch the graph of f 9 below it. 0 x
Trace or copy the graph of the given function f . (Assume that the axes have equal scales.) Then use the method of Example 1 to sketch the graph of f 9 below it. 0 x
Trace or copy the graph of the given function f . (Assume that the axes have equal scales.) Then use the method of Example 1 to sketch the graph of f 9 below it. x |0 y.
Trace or copy the graph of the given function f . (Assume that the axes have equal scales.) Then use the method of Example 1 to sketch the graph of f 9 below it. x |0 y
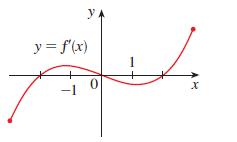
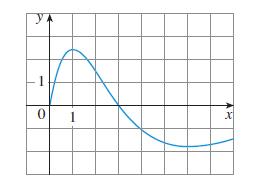
(a) f 9s0d (b) f 9s1d(c) f 9s2d (d) f 9s3d(e) f 9s4d (f) f 9s5d(g) f 9s6d (h) f 9s7dUse the given graph to estimate the value of each derivative.Then sketch the graph of f 9. 0 1 x
(a) f 9s23d (b) f 9s22d(c) f 9s21d (d) f 9s0d(e) f 9s1d (f) f 9s2d(g) f 9s3dUse the given graph to estimate the value of each derivative.Then sketch the graph of f 9. - 1
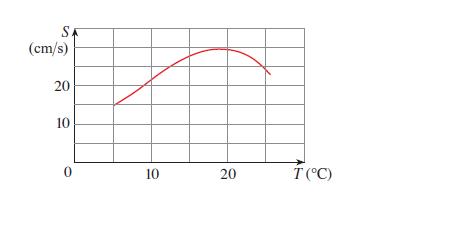
Swimming speed of salmon The graph at the right shows the influence of the temperature T on the maximum sustainable swimming speed S of Coho salmon.(a) What is the meaning of the derivative S9sTd? What are its units?(b) Estimate the values of S9s15d and S9s25d and interpret them. (cm/s) 20 20 10 10
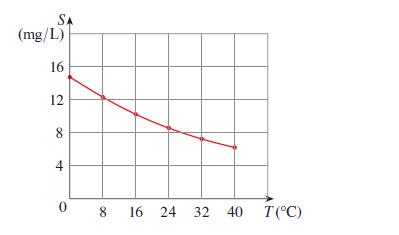
O xygen solubility The quantity of oxygen that can dissolve in water depends on the temperature of the water. (So thermal pollution influences the oxygen content of water.)The graph shows how oxygen solubility S varies as a function of the water temperature T.(a) What is the meaning of the
The quantity (in pounds) of a gourmet ground coffee that is sold by a coffee company at a price of p dollars per pound is Q − f s pd.(a) What is the meaning of the derivative f 9s8d? What are its units?(b) Is f 9s8d positive or negative? Explain.
The cost of producing x ounces of gold from a new gold mine is C − f sxd dollars.(a) What is the meaning of the derivative f 9sxd? What are its units?(b) What does the statement f 9s800d − 17 mean?(c) Do you think the values of f 9sxd will increase or decrease in the short term? What about the
Bacteria population The number of bacteria after t hours in a controlled laboratory experiment is n − f std.(a) What is the meaning of the derivative f 9s5d? What are its units?(b) Suppose there is an unlimited amount of space and nutrients for the bacteria. Which do you think is larger, f 9s5d
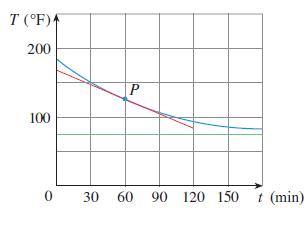
A roast turkey is taken from an oven when its temperature has reached 185°F and is placed on a table in a room where the temperature is 75°F. The graph shows how the temperature of the turkey decreases and eventually approaches room temperature. By measuring the slope of the tangent, estimate the
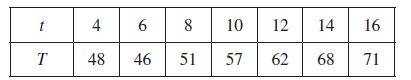
Let Tstd be the temperature (in °F) in Seattle t hours after midnight on May 7, 2012. The table shows values of this function recorded every two hours. What is the meaning of T9s12d? Estimate its value. t 4 6 8 8 10 12 14 16 T 48 46 51 57 62 68 71
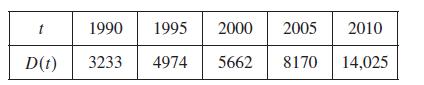
Let Dstd be the US national debt at time t. The table gives approximate values of the function by providing end of year estimates, in billions of dollars, from 1990 to 2010. Interpret and estimate the value of D9s2000d. t 1990 1995 2000 2005 2010 D(t) 3233 4974 5662 8170 14,025
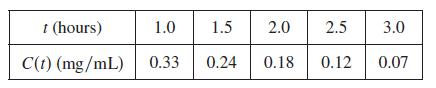
Blood alcohol concentration Researchers measured the average blood alcohol concentration Cstd of eight men starting one hour after consumption of 30 mL of ethanol(corresponding to two alcoholic drinks):(a) Find the average rate of change of C with respect to t over each time interval:(i) f1.0, 2.0g
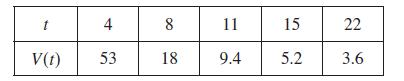
Viral load The table shows values of the viral load Vstd in HIV patient 303, measured in RNA copiesymL, t days after ABT-538 treatment was begun.(a) Find the average rate of change of V with respect to t over each time interval:(i) f4, 11g (ii) f8, 11g (iii) f11, 15g (iv) f11, 22g What are the
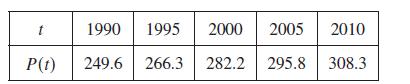
P opulation growth The table gives the US midyear population, in millions, from 1990 to 2010.(a) Find the average rate of population increase (i) from 1990 to 2000 (ii) from 1995 to 2000 (iii) from 2000 to 2005 (iv) from 2000 to 2010 (b) If Pstd is the population at time t, estimate and interpret
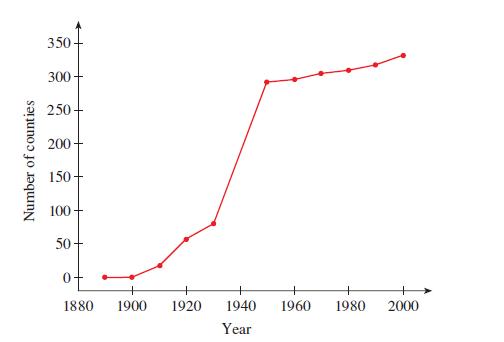
Invasive species The Argentine ant is an invasive species in North America.The graph shows the cumulative number of counties in the United States that have been invaded by this species over time.(a) Estimate the average rate of invasion between 1890 and 1920, between 1920 and 1960, and between 1960
The displacement (in meters) of a particle moving in a straight line is given by the equation of motion s − 1yt 2, where t is measured in seconds. Find the velocity of the particle at times t −a, t − 1, t − 2, and t − 3.
If a rock is thrown upward on the planet Mars with a velocity of 10 mys, its height (in meters) after t seconds is given by H − 10t 2 1.86t 2.(a) Find the velocity of the rock after one second.(b) Find the velocity of the rock when t − a.(c) When will the rock hit the surface?(d) With what
If a ball is thrown into the air with a velocity of 40 ftys, its height (in feet) after t seconds is given by y − 40t 2 16t 2.Find the velocity when t − 2.
f sxd − s1 2 2x Find f 9sad.
f sxd − x22 Find f 9sad.
f std −2t 1 1 t 1 3 Find f 9sad.
f std − 2t 3 1 t Find f 9sad.
f sxd − 3x2 2 4x 1 1 Find f 9sad.
(a) If Gsxd − 4x2 2 x3, find G9sad and use it to find equations of the tangent lines to the curve y − 4x2 2 x3 at the points s2, 8d and s3, 9d.; (b) Illustrate part (a) by graphing the curve and the tangent lines on the same screen.
(a) If Fsxd − 5xys1 1 x2d, find F9s2d and use it to find an equation of the tangent line to the curve y − 5xys1 1 x2d at the point s2, 2d.; (b) Illustrate part (a) by graphing the curve and the tangent line on the same screen.
If tsxd − x4 2 2, find t9s1d and use it to find an equation of the tangent line to the curve y − x4 2 2 at the point s1, 21d.
If f sxd − 3x2 2 x3, find f 9s1d and use it to find an equation of the tangent line to the curve y − 3x2 2 x3 at the point s1, 2d.
Sketch the graph of a function t for which ts0d − ts2d − ts4d − 0, t9s1d − t9s3d − 0, t9s0d − t9s4d − 1, t9s2d − 21, limx l ` tsxd − `, and limx l 2` tsxd − 2`.
Sketch the graph of a function f for which f s0d − 0, f 9s0d − 3, f 9s1d − 0, and f 9s2d − 21.
If the tangent line to y − f sxd at (4, 3) passes through the point (0, 2), find f s4d and f 9s4d.
If an equation of the tangent line to the curve y − f sxd at the point where a − 2 is y − 4x 2 5, find f s2d and f 9s2d.
Find an equation of the tangent line to the graph of y − tsxd at x − 5 if ts5d − 23 and t9s5d − 4.
(a) Find the slope of the tangent to the curve y − 1ysx at the point where x − a.(b) Find equations of the tangent lines at the points s1, 1d and s4, 12 d.; (c) Graph the curve and both tangents on a common screen.
(a) Find the slope of the tangent to the curve y − 3 1 4x2 2 2x3 at the point where x − a.(b) Find equations of the tangent lines at the points s1, 5d and s2, 3d.; (c) Graph the curve and both tangents on a common screen.
y −2x 1 1 x 1 2, s1, 1d Find an equation of the tangent line to the curve at the given point.
y − sx , s1, 1d Find an equation of the tangent line to the curve at the given point.
y − x3 2 3x 1 1, s2, 3d Find an equation of the tangent line to the curve at the given point.
y − 4x 2 3x2, s2, 24d Find an equation of the tangent line to the curve at the given point.
(a) Find the slope of the tangent line to the curve y − x 2 x3 at the point s1, 0d(i) using Definition 2 (ii) using Equation 3(b) Find an equation of the tangent line in part (a).; (c) Graph the curve and the tangent line in successively smaller viewing rectangles centered at s1, 0d until the
(a) Find the slope of the tangent line to the parabola y − 4x 2 x2 at the point s1, 3d(i) using Definition 2 (ii) using Equation 3(b) Find an equation of the tangent line in part (a).; (c) Graph the parabola and the tangent line. As a check on your work, zoom in toward the point s1, 3d until the
Graph the curve y − ex in the viewing rectangles f21, 1g by f0, 2g, f20.5, 0.5g by f0.5, 1.5g, and f20.1, 0.1g by f0.9, 1.1g. What do you notice about the curve as you zoom in toward the point s0, 1d?
A curve has equation y − f sxd.(a) Write an expression for the slope of the secant line through the points Ps3, f s3dd and Qsx, f sxdd.(b) Write an expression for the slope of the tangent line at P.
e2x 2− x, s0, 1d Use the Intermediate Value Theorem to show that there is a root of the equation in the given interval.
2x3 1 x2 1 2 − 0, s22, 21d Use the Intermediate Value Theorem to show that there is a root of the equation in the given interval.
Show that each function is continuous on its domain. State the domain.(a) tsxd − sx2 2 9 x2 2 2(b) hsxd − xesin x
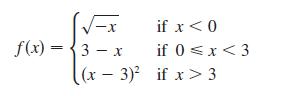
Let(a) Evaluate each limit, if it exists.(i) lim xl01 f sxd (ii) lim xl02 f sxd (iii) lim xl0 f sxd (iv) lim xl32 f sxd (v) lim xl31 f sxd (vi) lim xl3 f sxd (b) Where is f discontinuous?(c) Sketch the graph of f. -x f(x)=3x if x < 0 if 0 < x 3
Prove that limx l 0 x2 coss1yx2 d − 0.
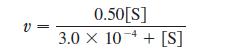
The Michaelis-Menten equation for the rate v of the enzymatic reaction of the concentration [S] of a substrate S, in the case of the enzyme pepsin, isWhat is lim fSgl`v? What is the meaning of the limit in this context? v = 0.50[S] 3.0 x 10 [S]
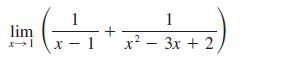
Find the limit. lim 1 - + x1 x23x+2,
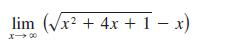
Find the limit. lim (x2+4x+1-x)
Find the limit. lim ex-2
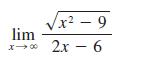
Find the limit. x-9 lim x10 2x-6
Find the limit. 1- 2x-x4 lim 5+x-3x4
Find the limit. lim In(sin x)
Showing 1500 - 1600
of 7357
First
9
10
11
12
13
14
15
16
17
18
19
20
21
22
23
Last
Step by Step Answers