New Semester
Started
Get
50% OFF
Study Help!
--h --m --s
Claim Now
Question Answers
Textbooks
Find textbooks, questions and answers
Oops, something went wrong!
Change your search query and then try again
S
Books
FREE
Study Help
Expert Questions
Accounting
General Management
Mathematics
Finance
Organizational Behaviour
Law
Physics
Operating System
Management Leadership
Sociology
Programming
Marketing
Database
Computer Network
Economics
Textbooks Solutions
Accounting
Managerial Accounting
Management Leadership
Cost Accounting
Statistics
Business Law
Corporate Finance
Finance
Economics
Auditing
Tutors
Online Tutors
Find a Tutor
Hire a Tutor
Become a Tutor
AI Tutor
AI Study Planner
NEW
Sell Books
Search
Search
Sign In
Register
study help
business
statistics econometrics
Biocalculus Calculus Probability And Statistics For The Life Sciences 1st Edition James Stewart, Troy Day - Solutions
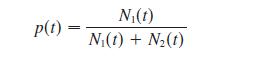
H omeostasis refers to a state in which the nutrient content of a consumer is independent of the nutrient content of its food. In the absence of homeostasis, a model proposed by Sterner and Elser is given by dy dx−1 y xwhere x and y represent the nutrient content of the food and the consumer,
When a raindrop falls, it increases in size and so its mass at time t is a function of t, namely, mstd. The rate of growth of the mass is kmstd for some positive constant k. When we apply Newton’s Law of Motion to the raindrop, we get smvd9 − tm, where v is the velocity of the raindrop(directed
Lung ventilation A patient is placed on a ventilator to remove CO2 from the lungs. Suppose that the rate of ventilation is 100 mLys, with the percentage of CO2 (by volume) in the inflow being zero. Suppose also that air is absorbed by the lungs at a rate of 10 mLys and gas consisting of 100% CO2 is
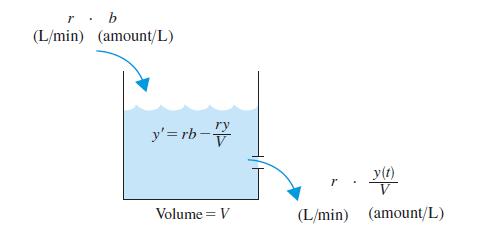
A vat with 500 gallons of beer contains 4% alcohol (by volume). Beer with 6% alcohol is pumped into the vat at a rate of 5 galymin and the mixture is pumped out at the same rate. What is the percentage of alcohol after an hour?Mixing problems Mixing problems arise in many areas of science. They
Dialysis treatment removes urea and other waste products from a patient’s blood by diverting some of the blood flow externally through a machine called a dialyzer. Suppose that a patient’s blood volume is V mL and blood is diverted through the dialyzer at a rate of K mLymin. At the start of
A tank contains 1000 L of brine with 15 kg of dissolved salt. Pure water enters the tank at a rate of 10 Lymin. The solution is kept thoroughly mixed and drains from the tank at the same rate. How much salt is in the tank (a) after t minutes? (b) After 20 minutes?Mixing problems Mixing problems
mRNA transcription The intermediate molecule mRNA arises in the decoding of DNA: it is produced by a process called transcription and it eventually decays. Suppose that the rate of transcription is changing exponentially according to the expression ebt, where b is a positive constant and mRNA has a
Glucose administration A glucose solution is administered intravenously to the bloodstream at a constant rate r.As the glucose is added, it is converted into other substances and removed from the bloodstream at a rate that is proportional to the concentration at that time. Thus a model for the
Mutation-selection balance The equation of Exercise 41 can be extended to account for a deleterious mutation that destroys the bacterial strain of interest. The differential equation becomes dp dt− sps1 2 pd 2 p ps0d − p0 where is the mutation rate and . 0 (see Exercise 7.2.19). Solve this
P opulation genetics Exercise 7.2.16 derives the following equation from population genetics that specifies the evolutionary dynamics of the frequency of a bacterial strain of interest:dp dt− sps1 2 pd ps0d − p0 where s is a constant. Find the solution, pstd.
In an elementary chemical reaction, single molecules of two reactants A and B form a molecule of the product C:A 1 B l C. The law of mass action states that the rate of reaction is proportional to the product of the concentrations of A and B:dfCg dt− k fAg fBg Thus, if the initial concentrations
T umor growth The Gompertz equation in Example 5 is not the only possibility for modeling tumor growth. Suppose that a tumor can be modeled as a spherical collection of cells and it acquires resources for growth only through its surface area (like the spherical bacterial colony in Exercise 38). All
dn dt− kn2y3 (spherical colony)Bacteria colony growth In Exercises 1.6.35–36, we obtained difference equations for the growth of circular and spherical colonies of bacteria. These equations are based on the idea that nutrients for growth are available only at the colony–environment interface.
dn dt− kn1y2 (circular colony)Bacteria colony growth In Exercises 1.6.35–36, we obtained difference equations for the growth of circular and spherical colonies of bacteria. These equations are based on the idea that nutrients for growth are available only at the colony–environment interface.
Weibull drug dissolution Solve the Weibull drug dissolution equation given in Exercise 7.1.15.
Noyes-Whitney drug dissolution Solve the initial-value problem in Exercise 7.1.14 for the Noyes-Whitney drug dissolution equation.
n9 − sr 2 atdn ns0d − n0 Here the per capita growth rate declines over time, going from positive to negative. It is modeled by the function r 2 at, where r and a are positive constants.Seasonality and habitat destruction The per capita growth rate of many species varies temporally for a variety
n9 − se2t 2 1dn ns0d − n0 Here the per capita growth rate declines over time, starting at zero and becoming negative. It is modeled by the function e2t 2 1.Seasonality and habitat destruction The per capita growth rate of many species varies temporally for a variety of reasons, including
n9 − e2tn ns0d − n0 Here the per capita growth rate declines over time, but always remains positive. It is modeled by the function e2t.Seasonality and habitat destruction The per capita growth rate of many species varies temporally for a variety of reasons, including seasonality and habitat
ysxd − 4 1 yx 02tsystd dt An integral equation is an equation that contains an unknown function ysxd and an integral that involves ysxd. Solve the given integral equation. [Hint: Use an initial condition obtained from the integral equation.]
ysxd − 2 1 yx 1dt tystd, x . 0 An integral equation is an equation that contains an unknown function ysxd and an integral that involves ysxd. Solve the given integral equation. [Hint: Use an initial condition obtained from the integral equation.]
ysxd − 2 1 yx 2ft 2 tystdg dt An integral equation is an equation that contains an unknown function ysxd and an integral that involves ysxd. Solve the given integral equation. [Hint: Use an initial condition obtained from the integral equation.]
y9 − xy(a) Use a computer algebra system to draw a direction field for the differential equation. Get a printout and use it to sketch some solution curves without solving the differential equation.(b) Solve the differential equation.(c) Use the CAS to draw several members of the family of
y9 − y2(a) Use a computer algebra system to draw a direction field for the differential equation. Get a printout and use it to sketch some solution curves without solving the differential equation.(b) Solve the differential equation.(c) Use the CAS to draw several members of the family of
Solve the equation y9 − xsx2 1 1ys yey d and graph several members of the family of solutions (if your CAS does implicit plots). How does the solution curve change as the constant C varies?
Solve the initial-value problem y9 − ssin xdysin y, ys0d − y2, and graph the solution (if your CAS does implicit plots).
Solve the equation e2yy9 1 cos x − 0 and graph several members of the family of solutions. How does the solution curve change as the constant C varies?
(a) Solve the differential equation y9 − 2xs1 2 y2 .; (b) Solve the initial-value problem y9 − 2xs1 2 y2 , ys0d − 0, and graph the solution.(c) Does the initial-value problem y9 − 2xs1 2 y2 , ys0d − 2, have a solution? Explain.
Solve the differential equation xy9 − y 1 xeyyx by making the change of variable v − yyx.
Solve the differential equation y9 − x 1 y by making the change of variable u − x 1 y.
Find the function f such that f 9sxd − f sxdf1 2 f sxdg and f s0d − 12.
Find an equation of the curve that passes through the point s0, 1d and whose slope at sx, yd is xy.
y9 tan x − a 1 y, ys y3d −a, 0 , x , y2 Find the solution of the differential equation that satisfies the given initial condition.==18.dL dt − kL2 ln t, Ls1d − 21 Find the solution of the differential equation that satisfies the given initial condition.
x ln x − ys1 1 s3 1 y2 dy9, ys1d − 1 Find the solution of the differential equation that satisfies the given initial condition.==16.dP dt − sPt , Ps1d − 2 Find the solution of the differential equation that satisfies the given initial condition.
y9 −xy sin x y 1 1, ys0d − 1 Find the solution of the differential equation that satisfies the given initial condition.
s y 1 sin ydy9 − x 1 x3 Solve the differential equation.==6.du dr −1 1 sr 1 1 su Solve the differential equation.==7.dy dt −tet ys1 1 y2 Solve the differential equation.==8.dy d −ey sin2 y sec Solve the differential equation.==9.du dt − 2 1 2u 1 t 1 tu Solve the differential
s y2 1 xy2dy9 − 1 Solve the differential equation.
sx2 1 1d y9 − xy Solve the differential equation.
(a) Program your computer algebra system, using Euler’s method with step size 0.01, to calculate ys2d, where y is the solution of the initial-value problem y9 − x3 2 y3 ys0d − 1 (b) Check your work by using the CAS to draw the solution curve.==1.dy dx − xy2 Solve the differential
(a) Program a calculator or computer to use Euler’s method to compute ys1d, where ysxd is the solution of the initial-value problem dy dx 1 3x2y − 6x2 ys0d − 3 for each of the given step sizes.(i) h − 1 (ii) h − 0.1 (iii) h − 0.01 (iv) h − 0.001 (b) Verify that y − 2 1 e2x3 is the
(a) Use Euler’s method with step size 0.2 to estimate ys0.4d, where ysxd is the solution of the initial-value problem y9 − x 1 y2, ys0d − 0.(b) Repeat part (a) with step size 0.1.
Use Euler’s method with step size 0.1 to estimate ys0.5d, where ysxd is the solution of the initial-value problem y9 − y 1 xy, ys0d − 1.
Use Euler’s method with step size 0.2 to estimate ys1d, where ysxd is the solution of the initial-value problem y9 − xy 2 x2, ys0d − 1.
Use Euler’s method with step size 0.5 to compute the approximate y-values y1, y2, y3, and y4 of the solution of the initial-value problem y9 − y 2 2x, ys1d − 0.
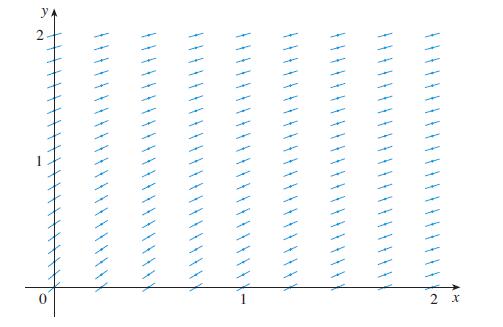
A direction field for a differential equation is shown in the figure. Draw, with a ruler, the graphs of the Euler approximations to the solution curve that passes through the origin. Use step sizes h − 1 and h − 0.5. Will the Euler estimates be underestimates or overestimates? Explain. y 2. 2 x
Suppose Ns0d − 0.2. Use Euler’s method with a step size of h − 0.5 to estimate the population size after four hours.Compare your result to the data in Table 7.1.1.Modeling yeast populations In Section 7.1 we introduced the following differential equation to describe the dynamics of an
Sketch the direction field of the differential equation for values of N between 0 and 250.Modeling yeast populations In Section 7.1 we introduced the following differential equation to describe the dynamics of an experimental yeast population:dN dt − s0.55 2 0.0026NdN where Nstd is the population
(a) Use Euler’s method with each of the following step sizes to estimate the value of ys0.4d, where y is the solution of the initial-value problem y9 − y, ys0d − 1.(i) h − 0.4 (ii) h − 0.2 (iii) h − 0.1(b) We know that the exact solution of the initial-value problem in part (a) is y −
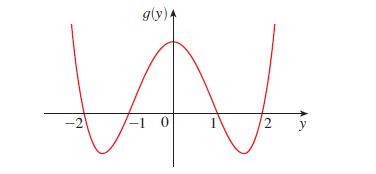
Make a rough sketch of a direction field for the autonomous differential equation y9 − ts yd, where the graph of t is as shown. How does the limiting behavior of solutions depend on the value of ys0d? g(y) W -2 -1 0 1 2 y
Use a computer algebra system to draw a direction field for the differential equation y9 − y3 2 4y. Get a printout and sketch on it solutions that satisfy the initial condition ys0d − c for various values ofc. For what values of c does limt l ` ystd exist? What are the possible values for this
y9 − xs y2 2 4d Use a computer algebra system to draw a direction field for the given differential equation. Get a printout and sketch on it the solution curve that passes through s0, 1d. Then use the CAS to draw the solution curve and compare it with your sketch.
y9 − x2 sin y Use a computer algebra system to draw a direction field for the given differential equation. Get a printout and sketch on it the solution curve that passes through s0, 1d. Then use the CAS to draw the solution curve and compare it with your sketch.
y9 − x 1 y2, s0, 0d Sketch the direction field of the differential equation.Then use it to sketch a solution curve that passes through the given point.
y9 − y 1 xy, s0, 1d Sketch the direction field of the differential equation.Then use it to sketch a solution curve that passes through the given point.
y9 − xy 2 x2, s0, 1d Sketch the direction field of the differential equation.Then use it to sketch a solution curve that passes through the given point.
y9 − y 2 2x, s1, 0d Sketch the direction field of the differential equation.Then use it to sketch a solution curve that passes through the given point.
y9 − x 2 y 1 1 Sketch a direction field for the differential equation. Then use it to sketch three solution curves.
y9 − 12 ySketch a direction field for the differential equation. Then use it to sketch three solution curves.
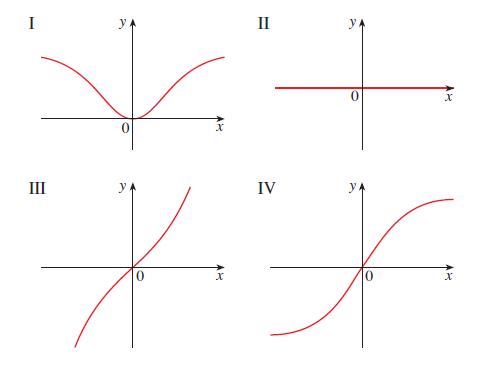
Use the direction field labeled IV (above) to sketch the graphs of the solutions that satisfy the given initial conditions.(a) ys0d − 21 (b) ys0d − 0 (c) ys0d − 1
Use the direction field labeled II (above) to sketch the graphs of the solutions that satisfy the given initial conditions.(a) ys0d − 1 (b) ys0d − 2 (c) ys0d − 21
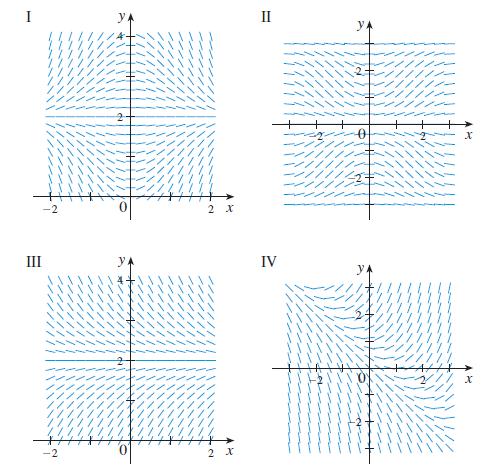
y9 − sin x sin y Match the differential equation with its direction field (labeled I–IV). Give reasons for your answer. I III IV 2 2
y9 − x 1 y 2 1 Match the differential equation with its direction field (labeled I–IV). Give reasons for your answer. I III IV 2 2
y9 − xs2 2 yd Match the differential equation with its direction field (labeled I–IV). Give reasons for your answer. I III IV 2 2
y9 − 2 2 y Match the differential equation with its direction field (labeled I–IV). Give reasons for your answer. I III IV 2 2
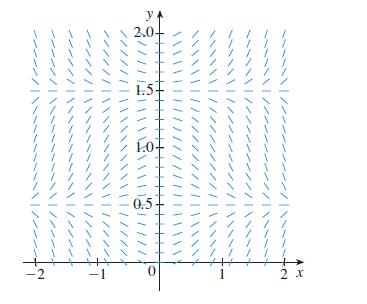
A direction field for the differential equation y9 − tans1 2yd is shown.(a) Sketch the graphs of the solutions that satisfy the given initial conditions.(i) ys0d − 1 (ii) ys0d − 0.2 (iii) ys0d − 2 (iv) ys1d − 3 (b) Find all the equilibrium solutions. 0 T 2 \\\\/ // | | \ \ \\//\\ \\\\/ //
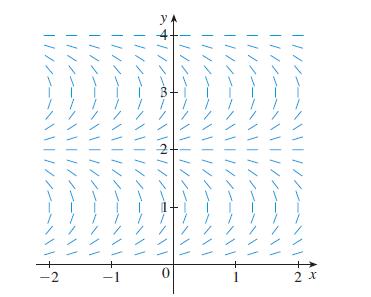
A direction field for the differential equation y9 − x cos y is shown.(a) Sketch the graphs of the solutions that satisfy the given initial conditions.(i) ys0d − 0 (ii) ys0d − 0.5 (iii) ys0d − 1 (iv) ys0d − 1.6 (b) Find all the equilibrium solutions. INS ///////\\\\\\\\\\/////// ////////
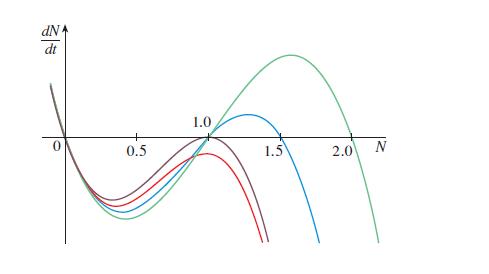
Catastrophic population collapse The graph depicting the rate of change of a population as a function of population size is given by the green curve in the figure, with N measured in thousands of individuals. Suppose the population size starts between 1000 and 2000 individuals.(a) What is the
Mutation-selection balance The population-genetic differential equation in Exercise 16 assumes there is no mutation. Suppose that strain 1 bacteria mutate to strain 2 at a per capita rate of , but otherwise their dynamics are exactly as given in Exercise 16.(a) What is the resulting differential
Bacterial cross-feeding (cont.) The differential equation derived in Exercise 17 (and from Example 7) is dp dt− ps1 2 pdf s1 2 pd 2 pg where and are both positive constants.(a) Find all equilibria.(b) Determine the values of and for which each equilibrium in part (a) is locally stable.
Bacterial cross-feeding The differential equation from Exercise 16 can be extended to model the effects of bacterial cross-feeding. Suppose that the growth rate of strain 1 (r1)is zero when the frequency of strain 2 is zero and that it increases linearly to a maximum value of when the frequency
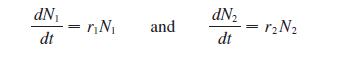
Bacteria population genetics Suppose there are two bacterial strains 1 and 2, each undergoing growth according to the differential equationsrespectively, where r1 ± r2. Defineto be the frequency of strain 1 at time t.(a) Differentiate p using its definition to show that p obeys the differential
Levins’ metapopulation model Many species are made up of several small subpopulations that occasionally go extinct but that are subsequently recolonized. The entire collection of subpopulations is referred to as a metapopulation.One way to model this phenomenon is to keep track of only the
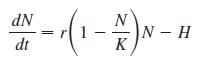
H arvesting of renewable resources Suppose a population grows according to the logistic equation but is subject to a constant total harvest rate of H. If Nstd is the population size at time t, the population dynamics areDifferent values of H result in different equilibrium population sizes; if H is
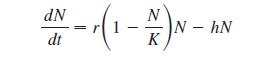
H arvesting of renewable resources Suppose a population grows according to the logistic equation but is subject to a constant per capita harvest rate of h. If Nstd is the population size at time t, the population dynamics areDifferent values of h result in different equilibrium population sizes; if
I nfectious disease dynamics The spread of an infectious disease, such as influenza, is often modeled using the following autonomous differential equation:dI dt− IsN 2 I d 2 I where I is the number of infected people, N is the total size of the population being modeled, is a constant
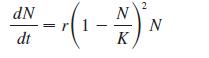
Suppose that the population dynamics of a species obeys a modified version of the logistic differential equation having the following form:where r ± 0 and K . 0.(a) Show that N^ − 0 and N^ − K are equilibria.(b) For which values of r is the equilibrium N^ − 0 unstable?(c) Apply the local
T he Allee effect For the model of population dynamics from Example 3, use the local stability criterion to verify that N^ − 0 and N^ − K are locally stable whereas N^ − a is unstable.
Find the equilibria for the differential equation and determine the values of a for which each equilibrium is locally stable. Assume a ± 0.(a) y9 − 1 1 ay(b) y9 − 1 2 e2ay(c) y9 − aey cos y, 0 , y , (d) y9 − ysa 2 yd
(a) y9 − 5ys2e2y 2 1d(b) y9 − y5y3 2 2y (assume y > 0d Find all equilibria and use the local stability criterion to determine if each is locally stable or unstable. Then construct the phase plot.
(a) y9 − 5 2 3y (b) y9 − 2y 2 3y2 Find all equilibria and use the local stability criterion to determine if each is locally stable or unstable. Then construct the phase plot.
(a) y9 −y2 2 a y 1 1, 0 < a , 1, y . 21(b) y9 − ysa 2 yd 2sb 2 yd, b . a > 0(c) y9 −a b 1 y 2 1, a . b . 0, y > 0 Find all equilibria of the autonomous differential equation and construct the phase plot.
(a) y9 − y 1 2 ln y, y . 0(b) y9 − y3 2a, a > 0(c) y9 −5 2 1 y, y > 0 Find all equilibria of the autonomous differential equation and construct the phase plot.
(a) y9 − y2 2 2(b) y9 −y 2 3 y 1 9, y > 0(c) y9 − ys3 2 yds25 2 y2d Find all equilibria of the autonomous differential equation and construct the phase plot.
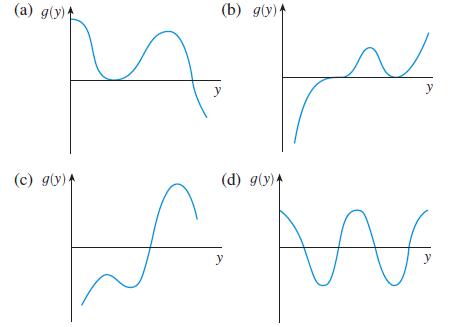
Complete the phase plot for each graph by locating the equilibria and indicating the direction in which y changes on the horizontal axis. (a) g(y) y (b) g(y) (c) g(y)^ y (d) g(y) N
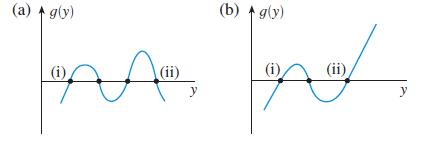
For each graph, determine whether the equilibria (i) and (ii)are unstable. (a) g(y) (i) (ii) A (b) g(y) T (i) (ii) y
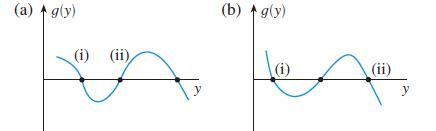
For each graph, determine whether the equilibria (i) and (ii)are locally stable. (a) g(y) (i) (ii) (b) g(y) (i) (ii)
Modeling yeast populations (cont.) Verify thatis an approximate solution of the differential equation dN dt − s0.55 2 0.0026NdN N(t) = 42e0.551 209.8 +0.2e0.551
Modeling yeast populations Use the fact that the per capita growth rate of the yeast population in Table 1 is 0.55 2 0.0026N to show that, in terms of the logistic equation (4), r − 0.55 and K < 210.
T he logistic differential equation Suppose that the per capita growth rate of a population of size N declines linearly from a value of r when N − 0 to a value of 0 when N − K. Show that the differential equation for N is dN dt− rS1 2 NKD N
The Weibull equation for the dynamics of the drug concentration is dc dt−k t b scs 2 cd where k, cs, and b are positive constants and b , 1. Notice that this differential equation is undefined when t − 0. Is this differential equation pure-time, autonomous, or nonautonomous?State in words what
The Noyes-Whitney equation for the dynamics of the drug concentration is dc dt− kscs 2 cd where k and cs are positive constants. Is this differential equation pure-time, autonomous, or nonautonomous? State in words what this differential equation says about how drug dissolution occurs. Verify
The zero-order kinetic equation states that the rate of change in the concentration of drug c (in mgymL) during dissolution is governed by the differential equation dc dt− k where k is a positive constant. Is this differential equation pure-time, autonomous, or nonautonomous? State in words what
Von Bertalanffy’s equation states that the rate of growth in length of an individual fish is proportional to the difference between the current length L and the asymptotic length L` (in cm).(a) Write a differential equation that expresses this idea.(b) Make a rough sketch of the graph of a
Match the differential equations with the solution graphs labeled I–IV. Give reasons for your choices.(a) y9 − 1 1 x2 1 y2 (b) y9 − xe2x22y2(c) y9 −1 1 1 ex21y2 (d) y9 − sinsxyd cossxyd IV J 0 A 0 II x 0 0 III
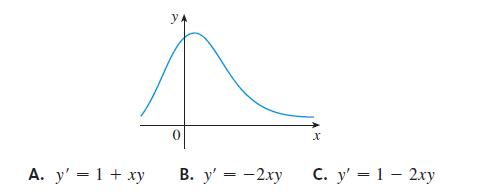
The function with the given graph is a solution of one of the following differential equations. Decide which is the correct equation and justify your answer. A A. y' = 1 + xy B. y' = -2xy X C. y' 12xy
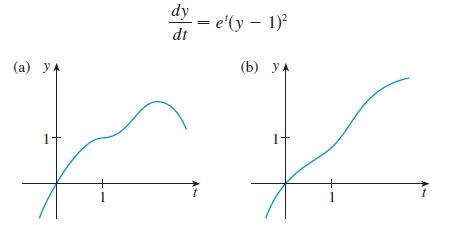
Explain why the functions with the given graphs can’t be solutions of the differential equation dy dt (a) y) 1 1 e'(y-1) (b) y^ i 1
T he Fitzhugh-Nagumo model for the electrical impulse in a neuron states that, in the absence of relaxation effects, the electrical potential in a neuron vstd obeys the differential equation dv dt− 2vfv 2 2 s1 1 adv 1 ag where a is a constant and 0 , a , 1.(a) For what values of v is v unchanging
Logistic growth A population is modeled by the differential equation dN dt− 1.2NS1 2 N4200D where Nstd is the number of individuals at time t (measured in days).(a) For what values of N is the population increasing?(b) For what values of N is the population decreasing?(c) What are the equilibrium
(a) What can you say about the graph of a solution of the equation y9 − xy3 when x is close to 0? What if x is large?(b) Verify that all members of the family y − sc 2 x2 d21y2 are solutions of the differential equation y9 − xy3.; (c) Graph several members of the family of solutions on a
(a) What can you say about a solution of the equation y9 − 2y2 just by looking at the differential equation?(b) Verify that all members of the family y − 1ysx 1 Cd are solutions of the equation in part (a).(c) Can you think of a solution of the differential equation y9 − 2y2 that is not a
Showing 100 - 200
of 7357
1
2
3
4
5
6
7
8
9
10
11
12
13
14
15
Last
Step by Step Answers