

Question: Create a frequency polygon (line graph) for the data in Table 1.32 Age, years 16-17 18-20 21-24 25-29 30-34 35-39 40-44 45-54 55 and over
Create a frequency polygon (line graph) for the data in Table 1.32
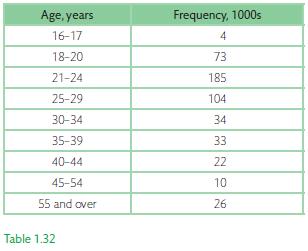
Age, years 16-17 18-20 21-24 25-29 30-34 35-39 40-44 45-54 55 and over Table 1.32 Frequency, 1000s 4 73 185 104 34 33 22 10 26
Step by Step Solution
★★★★★
3.35 Rating (164 Votes )
There are 3 Steps involved in it
1 Expert Approved Answer
Step: 1 Unlock

Answer below is frequency polygon li... View full answer
Question Has Been Solved by an Expert!
Get step-by-step solutions from verified subject matter experts
Step: 2 Unlock
Step: 3 Unlock