

Question: Create a suitable histogram to represent the spending on extracurricular activities for a random sample of university students during the ninth week of the first
Create a suitable histogram to represent the spending on extracurricular activities for a random sample of university students during the ninth week of the first term (Table 1.27).
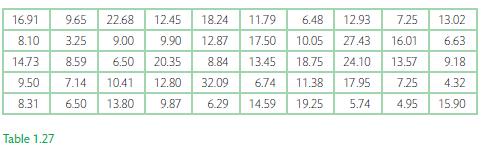
16.91 8.10 14.73 9.50 8.31 Table 1.27 6.48 12.93 7.25 13.02 12.87 17.50 10.05 27.43 16.01 6.63 13.45 18.75 24.10 13.57 9.18 6.74 11.38 17.95 7.25 4.32 14.59 19.25 5.74 4.95 15.90 9.65 22.68 12.45 18.24 11.79 3.25 9.00 9.90 8.59 6.50 20.35 8.84 7.14 10.41 12.80 32.09 6.50 13.80 9.87 6.29
Step by Step Solution
★★★★★
3.34 Rating (148 Votes )
There are 3 Steps involved in it
1 Expert Approved Answer
Step: 1 Unlock

Question Has Been Solved by an Expert!
Get step-by-step solutions from verified subject matter experts
Step: 2 Unlock
Step: 3 Unlock