

Question: Answer the following questions using the data from the Excel file amazon.xlsx described in Problem 16.30: a. Forecast the advertising revenue for each quarter in
Answer the following questions using the data from the Excel file amazon.xlsx described in Problem 16.30:
a. Forecast the advertising revenue for each quarter in 2018 using seasonal dummy variables and a best subsets regression.
b. Interpret the meaning of the coefficients for the seasonal dummy variables.
c. Calculate the MAD for this forecast.
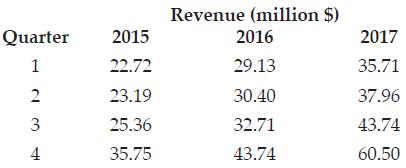
Revenue (million $) Quarter 2015 2016 2017 22.72 29.13 35.71 2 23.19 30.40 37.96 3 25.36 32.71 43.74 4 35.75 43.74 60.50 1,
Step by Step Solution
3.38 Rating (157 Votes )
There are 3 Steps involved in it
a Dummy Variables SD1 SD2 SD3 Quarter 1 0 0 0 Quarter 2 1 0 0 Quarter 3 0 1 0 Quarter 4 0 0 1 Set x ... View full answer

Get step-by-step solutions from verified subject matter experts