

Average annual interest rates (banks, prime lending) in the United States from 1980 through 2006 are shown
Question:
Average annual interest rates (banks, prime lending) in the United States from 1980 through 2006 are shown in the following time series graph:
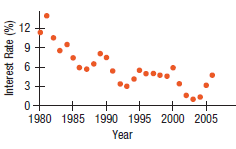
a) What components do you see in this series? Here’s a linear trend model fit to these data:
Dependent variable is: Interest Rate
R-squared = 69.9% R-squared (adjusted) = 68.7%
s = 1.732 with 27 - 2 = 25 degrees of freedom
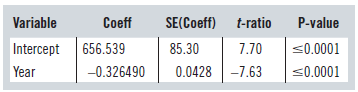
b) Interpret the trend coefficient mean in this model.
c) Predict the interest rate for 2006. Do you trust the prediction? Why or why not? Here’s a time series plot of the residuals from this model:
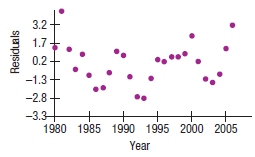
d) Discuss any patterns you see in this plot.
e) Would an exponential transformation likely do better for these data? Explain.
Step by Step Answer:
a There is a decreasing trend component b Interest rates ...View the full answer


Business Statistics
ISBN: 9780133899122
3rd Canadian Edition
Authors: Norean D. Sharpe, Richard D. De Veaux, Paul F. Velleman, David Wright
