

Canadian retail sales in dollars for September 2006 to August 2009 are shown in the graph for
Question:
Canadian retail sales in dollars for September 2006 to August 2009 are shown in the graph for Exercise 33. An autoregressive model has been fitted with two independent variables at lags of 1 and 12, with the following result:
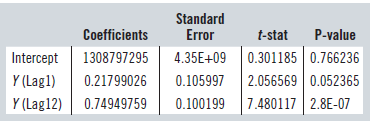
Retail sales from September 2008 to August 2009 were: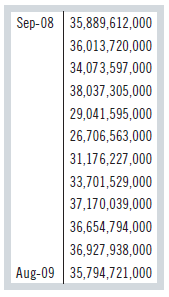
a) What feature in the graph in Exercise 33 leads us to include Y(Lag12) in the model?
b) What does the coefficient of Y(Lag1) represent?
c) What does the coefficient of Y(Lag12) represent?
d) What is the forecast of retail sales for September 2009?
Fantastic news! We've Found the answer you've been seeking!
Step by Step Answer:
a The graph shows annual seasonality with a period of 12 months b The coefficient ...View the full answer

Answered By
PALASH JHANWAR
I am a Chartered Accountant with AIR 45 in CA - IPCC. I am a Merit Holder ( B.Com ). The following is my educational details.
PLEASE ACCESS MY RESUME FROM THE FOLLOWING LINK: https://drive.google.com/file/d/1hYR1uch-ff6MRC_cDB07K6VqY9kQ3SFL/view?usp=sharing
3+ Reviews
10+ Question Solved
Related Book For 

Business Statistics
ISBN: 9780133899122
3rd Canadian Edition
Authors: Norean D. Sharpe, Richard D. De Veaux, Paul F. Velleman, David Wright
Question Posted:
