

Canadian retail sales in dollars for September 2006August 2009 are shown in the graph. The horizontal axis
Question:
Canadian retail sales in dollars for September 2006–August 2009 are shown in the graph. The horizontal axis represents the number of months since August 2006.
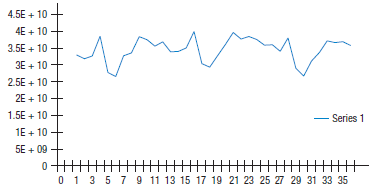
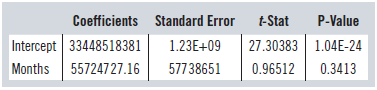
A linear regression analysis gives the following result:
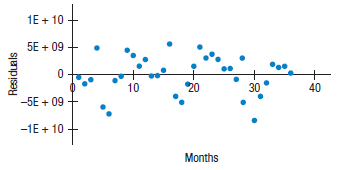
The residual graph is:
a) What does the intercept represent?
b) What does the coefficient of months represent?
c) What is the forecast of the retail sales for October 2009?
d) What do you notice about the residuals?
e) Do you think the R2 value for this regression is high or low?
Fantastic news! We've Found the answer you've been seeking!
Step by Step Answer:
a The intercept represents an estimate of retail sales in September 2006 b The ...View the full answer

Answered By
Ayush Jain
Subjects in which i am expert:
Computer Science :All subjects (Eg. Networking,Database ,Operating System,Information Security,)
Programming : C. C++, Python, Java, Machine Learning,Php
Android App Development, Xamarin, VS app development
Essay Writing
Research Paper
History, Management Subjects
Mathematics :Till Graduate Level
1+ Reviews
10+ Question Solved
Related Book For 

Business Statistics
ISBN: 9780133899122
3rd Canadian Edition
Authors: Norean D. Sharpe, Richard D. De Veaux, Paul F. Velleman, David Wright
Question Posted:
