

Construct a percentage pie chart of the overall design quality ratings for each of the following: automobiles
Question:
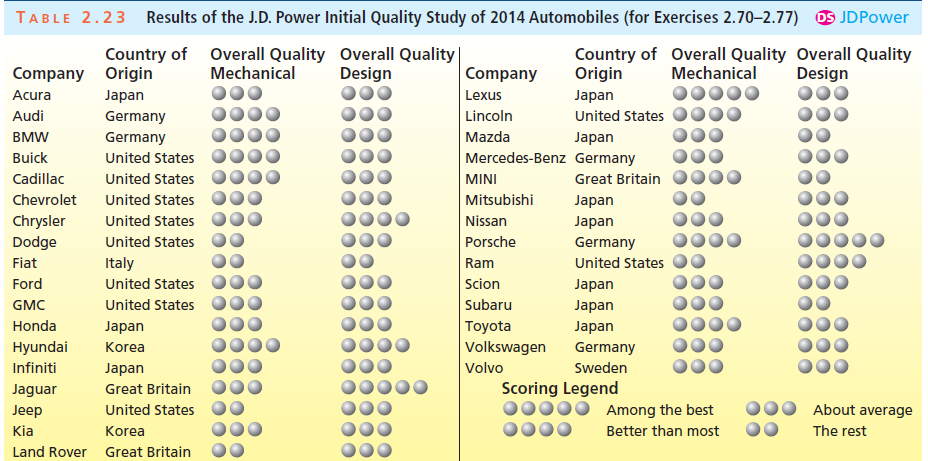
Based on the data in Table 2.23 (see page 100). This table gives the results of the J.D. Power initial quality study of 2014 automobiles. Each model is rated on overall mechanical quality and overall design quality on a scale from €œamong the best€ to €œthe rest€ (see the Scoring Legend).
Fantastic news! We've Found the answer you've been seeking!
Step by Step Answer:
All three regions have a majority of mode...View the full answer

Answered By
Sagar Kumar
I am Mechanical Engineer with CGPA of 3.98 out of 4.00 from Pakistan. I went to Government Boys Degree College, Sehwan for high school studies.
I appeared in NUST Entrance Exam for admission in university and ranked #516. My mathematics are excellent and I have participated in many math competitions and also won many of them. Recently, I participated in International Youth Math Challenge and was awarded with Gold Honor. Now, I am also an ambassador at International Youth Math Challenge,
I have been teaching when I was in 9th class class year 2012. I have taught students from 6th class to university level.
1+ Reviews
10+ Question Solved
Related Book For 

Business Statistics In Practice Using Data Modeling And Analytics
ISBN: 9781259549465
8th Edition
Authors: Bruce L Bowerman, Richard T O'Connell, Emilly S. Murphree
Question Posted:
