

Recall that Table 1.10 presents the breaking strengths of 40 trash bags selected during a 40-hour pilot
Question:
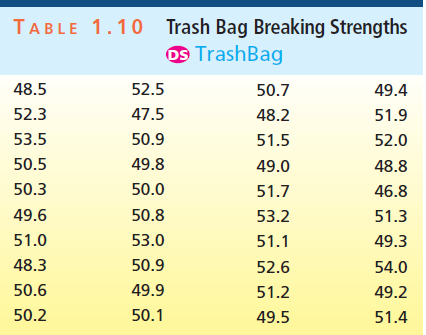
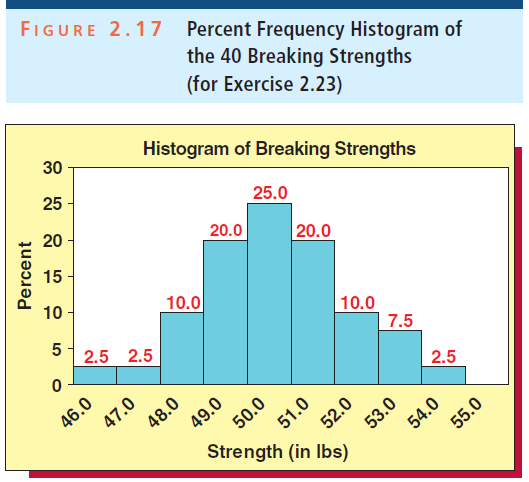
a. Describe where the breaking strengths seem to be concentrated.
b. Describe and interpret the shape of the distribution of breaking strengths.
c. What is the class length?
d. Write out the classes and construct a percent frequency ogive for the breaking strengths using these classes.
The word "distribution" has several meanings in the financial world, most of them pertaining to the payment of assets from a fund, account, or individual security to an investor or beneficiary. Retirement account distributions are among the most...
Fantastic news! We've Found the answer you've been seeking!
Step by Step Answer:
a The trash bag breaking strengths are concentrated between 48 and 53 ...View the full answer

Answered By
Sidharth Jain
My name is Sidharth. I completed engineering from National Institute of Technology Durgapur which is one of the top college in India. I am currently working as an Maths Faculty in one of the biggest IITJEE institute in India. Due to my passion in teaching and Maths, I came to this field. I've been teaching for almost 3 years.
Apart from it I also worked as an Expert Answerer on Chegg.com. I have many clients from USA to whom I teach online and help them in their assignments. I worked on many online classes on mymathlab and webassign. I guarantee for grade 'A'.
3+ Reviews
10+ Question Solved
Related Book For 
Business Statistics In Practice Using Data Modeling And Analytics
ISBN: 9781259549465
8th Edition
Authors: Bruce L Bowerman, Richard T O'Connell, Emilly S. Murphree
Question Posted:
