

Question: The following correlation matrix and the scatterplot matrix shown below summarize the same data, only we scrambled the order of the variables in the two
The following correlation matrix and the scatterplot matrix shown below summarize the same data, only we scrambled the order of the variables in the two views. If the labels X, Y, Z, and T are as given in the scatterplot matrix, label the rows and columns in the correlation matrix.
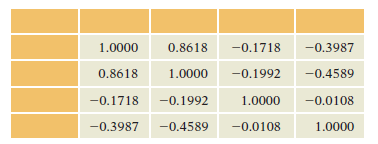
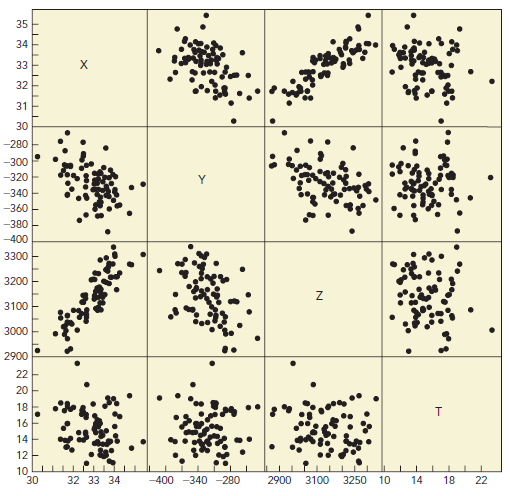
0.8618 0.8618 -0.1718 -0.3987 1.0000 -0.1992 0.8618 1.0000 -0.4589 -0.1718 -0.1992 -0.0108 1.0000 -0.3987 -0.4589 -0.0108 1.0000 35 34 33 X. 32 31 30 -280 -300 -320 -340 -360 -380 -400 3300 3200 3100 3000 2900 22 20 18 16 14 12 10 30 32 33 34 -400 -340 -280 2900 3100 3250 10 14 18 22
Step by Step Solution
3.46 Rating (166 Votes )
There are 3 Steps involved in it
The order of the variables in th... View full answer

Get step-by-step solutions from verified subject matter experts