

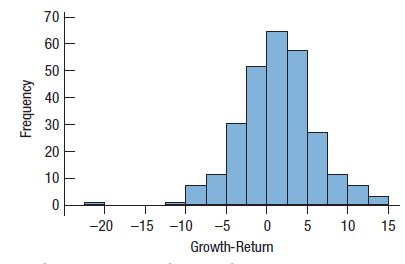
The following histogram displays the monthly returns for a group of mutual funds considered aggressive (or high-growth)
Question:
The following histogram displays the monthly returns for a group of mutual funds considered aggressive (or high-growth) over a period of 22 years, from 1975 to 1997:
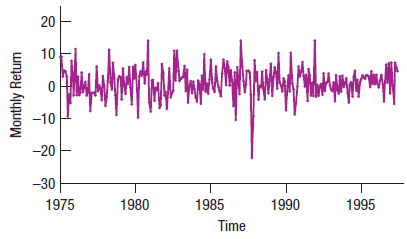
Here is the time series plot for the same data:
a) What features of the data can you see in the histogram that aren’t clear from the time series plot?
b) What features of the data can you see in the time series plot that aren’t clear in the histogram?
c) Which graphical display seems more appropriate for these data? Explain.
d) Write a brief description of monthly mutual fund returns over this time period.
Mutual FundsMutual funds are like a pool of funds gathered by different small investors that have simalar investment perspective about returns on their investments. These funds are managed by professional investment managers who act smartly on behalf of the...
Fantastic news! We've Found the answer you've been seeking!
Step by Step Answer:
a The distribution of returns is unimodal and symmetric with one very ...View the full answer

Answered By
Mary Boke
As an online tutor with over seven years of experience and a PhD in Education, I have had the opportunity to work with a wide range of students from diverse backgrounds. My experience in education has allowed me to develop a deep understanding of how students learn and the various approaches that can be used to facilitate their learning. I believe in creating a positive and inclusive learning environment that encourages students to ask questions and engage with the material. I work closely with my students to understand their individual learning styles, strengths, and challenges to tailor my approach accordingly. I also place a strong emphasis on building strong relationships with my students, which fosters trust and creates a supportive learning environment. Overall, my goal as an online tutor is to help students achieve their academic goals and develop a lifelong love of learning. I believe that education is a transformative experience that has the power to change lives, and I am committed to helping my students realize their full potential.
4+ Reviews
21+ Question Solved
Related Book For 

Business Statistics
ISBN: 9780133899122
3rd Canadian Edition
Authors: Norean D. Sharpe, Richard D. De Veaux, Paul F. Velleman, David Wright
Question Posted:
