

The following table gives the value of the Dow Jones Industrial Average (DJIA), NASDAQ, and the S&P
Question:
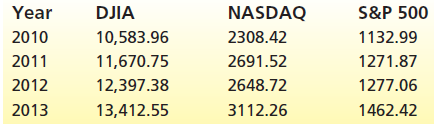
a. For each stock index, compute the rate of return from 2010 to 2011, from 2011 to 2012, and from 2012 to 2013.
b. Calculate the geometric mean rate of return for each stock index for the period from 2010 to 2013.
c. Suppose that an investment of $100,000 is made in 2010 and that the portfolio performs with returns equal to those of the DJIA. What is the investment worth in 2013?
d. Repeat part c for the NASDAQ and the S&P 500.
A portfolio is a grouping of financial assets such as stocks, bonds, commodities, currencies and cash equivalents, as well as their fund counterparts, including mutual, exchange-traded and closed funds. A portfolio can also consist of non-publicly...
Fantastic news! We've Found the answer you've been seeking!
Step by Step Answer:
a Year DJIA NASDAQ SP 500 2010 1058396 230842 113299 2011 1167075 269152 ...View the full answer

Answered By
Joemar Canciller
I teach mathematics to students because I love to share what I have in this field.
I also want to see the students to love math and be fearless in this field.
I've been tutoring these past 2 years and I would like to continue what I've been doing.
1+ Reviews
10+ Question Solved
Related Book For 
Business Statistics In Practice Using Data Modeling And Analytics
ISBN: 9781259549465
8th Edition
Authors: Bruce L Bowerman, Richard T O'Connell, Emilly S. Murphree
Question Posted:
