

Question: The graphs accompanying this exercise are based on data from an experiment to assess the effects of logging on a squirrel population in British Columbia
The graphs accompanying this exercise are based on data from an experiment to assess the effects of logging on a squirrel population in British Columbia (?Effects of Logging Pattern and Intensity on Squirrel Demography,? The Journal of Wildlife Management [2007]: 2655?2663). Plots of land, each 9 hectares in area, were subjected to different percentages of logging, and the squirrel population density for each plot was measured after 3 years. The scatterplot, residual plot, and a boxplot of the residuals are shown on the next page. Does it appear that the assumptions of the simple linear regression model are plausible? Explain.
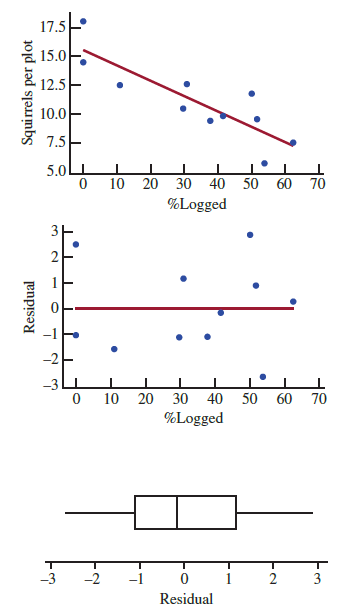
17.5 15.0 12.5- 10.0 7.5- 5.0L 10 20 30 40 50 60 70 %Logged -3LL 10 20 30 40 50 60 70 %Logged -3 -2 -1 3 Residual Residual Squirrels per plot 2. 3.
Step by Step Solution
3.40 Rating (162 Votes )
There are 3 Steps involved in it
There is a random scatter of points in the residual plot implyi... View full answer

Get step-by-step solutions from verified subject matter experts