

The graphs in Exercises 25 and 26 show Canadian wheat exports in dollars from January 2006 to
Question:
The graphs in Exercises 25 and 26 show Canadian wheat exports in dollars from January 2006 to May 2009. (Source: Based on Statistics Canada. [2011]. CANSIM Table 228-0001—Merchandise imports and exports, by major groups and principal trading areas for all countries, monthly [dollars].) The last four months of data are as follows:
2009–02...........................511,600,000
2009–03...........................478,900,000
2009–04...........................764,500,000
2009–05...........................658,300,000
An exponential smoothing model, ES, with α = 0.2 gives a smoothed value of $585,200,000 for April 2009.
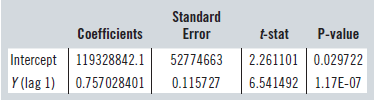
An autoregressive model with one lagged independent variable, AR(1), gives:
a) Give three values for May 2009 from MA-4, ES, and AR(1).
b) Calculate the absolute percentage error, APE, for May 2009 for each of the three values.
Step by Step Answer:
a MA4 average of 4 data points 51160000047890000076450000065830...View the full answer


Business Statistics
ISBN: 9780133899122
3rd Canadian Edition
Authors: Norean D. Sharpe, Richard D. De Veaux, Paul F. Velleman, David Wright
