

This data set tracks monthly performance of stock in Apple from January 1990 through December 2015, a
Question:
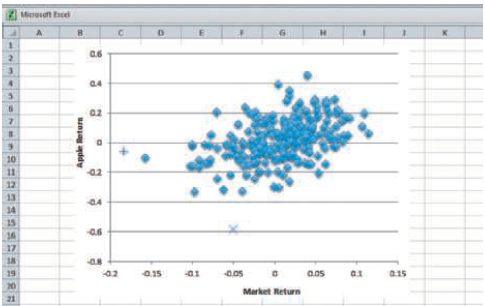
(a) Do these data meet the conditions of the SRM?
(b) Identify the time period associated with each of the two outliers highlighted in this scatterplot. What€™s special, if anything, about these two months?
(c) Which observation is more important to the precision of the estimated slope? That is, if we must drop one of these two but want to keep the standard error of the slope as small as possible, which month should be retained?
(d) Explain why the observation that keeps the t-statistic large is more influential than the other observation.
(e) Explain why removing either observation has little effect on the least squares fit.
A portfolio is a grouping of financial assets such as stocks, bonds, commodities, currencies and cash equivalents, as well as their fund counterparts, including mutual, exchange-traded and closed funds. A portfolio can also consist of non-publicly...
Fantastic news! We've Found the answer you've been seeking!
Step by Step Answer:
a The residuals are not nearly normal a very slight cro...View the full answer

Answered By
Utsab mitra
I have the expertise to deliver these subjects to college and higher-level students. The services would involve only solving assignments, homework help, and others.
I have experience in delivering these subjects for the last 6 years on a freelancing basis in different companies around the globe. I am CMA certified and CGMA UK. I have professional experience of 18 years in the industry involved in the manufacturing company and IT implementation experience of over 12 years.
I have delivered this help to students effortlessly, which is essential to give the students a good grade in their studies.
2+ Reviews
10+ Question Solved
Related Book For 
Statistics For Business Decision Making And Analysis
ISBN: 9780134497167
3rd Edition
Authors: Robert A. Stine, Dean Foster
Question Posted:
