

Hasbro, Inc., sells toys and games in over 120 countries, including popular brands such as Nerf and
Question:
Hasbro, Inc., sells toys and games in over 120 countries, including popular brands such as Nerf and Play-Doh. The following are selected financial data for the company for the period 2012–2016.
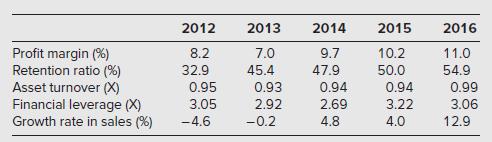
a. Calculate Hasbro’s annual sustainable growth rate from 2012 through 2016.
b. What growth management challenge did Hasbro face during these years?
c. How did Hasbro deal with this challenge?
Fantastic news! We've Found the answer you've been seeking!
Step by Step Answer:
a Hasbros sustainable growth rates are For example in 2016 g 110 549 099 306 183 b ...View the full answer

Answered By
PALASH JHANWAR
I am a Chartered Accountant with AIR 45 in CA - IPCC. I am a Merit Holder ( B.Com ). The following is my educational details.
PLEASE ACCESS MY RESUME FROM THE FOLLOWING LINK: https://drive.google.com/file/d/1hYR1uch-ff6MRC_cDB07K6VqY9kQ3SFL/view?usp=sharing
3+ Reviews
10+ Question Solved
Related Book For 
ISE Analysis For Financial Management
ISBN: 9781265042639
13th International Edition
Authors: Robert C. Higgins Professor, Jennifer Koski
Question Posted:
