

Figure P 41.41 shows the first few energy levels of the lithium atom. Make a table showing
Question:
Figure P 41.41 shows the first few energy levels of the lithium atom. Make a table showing all the allowed transitions in the emission spectrum. For each transition, indicate
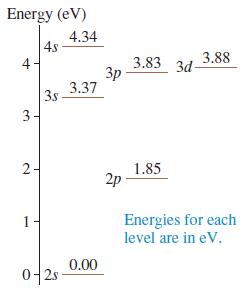
a. The wavelength, in nm.
b. Whether the transition is in the infrared, the visible, or the ultraviolet spectral region.
c. Whether or not the transition would be observed in the lithium absorption spectrum.
Fantastic news! We've Found the answer you've been seeking!
Step by Step Answer:
Visualize ab and c Solve We need to use the condition l 1 ...View the full answer

Answered By
Asim farooq
I have done MS finance and expertise in the field of Accounting, finance, cost accounting, security analysis and portfolio management and management, MS office is at my fingertips, I want my client to take advantage of my practical knowledge. I have been mentoring my client on a freelancer website from last two years, Currently I am working in Telecom company as a financial analyst and before that working as an accountant with Pepsi for one year. I also join a nonprofit organization as a finance assistant to my job duties are making payment to client after tax calculation, I have started my professional career from teaching I was teaching to a master's level student for two years in the evening.
My Expert Service
Financial accounting, Financial management, Cost accounting, Human resource management, Business communication and report writing. Financial accounting : • Journal entries • Financial statements including balance sheet, Profit & Loss account, Cash flow statement • Adjustment entries • Ratio analysis • Accounting concepts • Single entry accounting • Double entry accounting • Bills of exchange • Bank reconciliation statements Cost accounting : • Budgeting • Job order costing • Process costing • Cost of goods sold Financial management : • Capital budgeting • Net Present Value (NPV) • Internal Rate of Return (IRR) • Payback period • Discounted cash flows • Financial analysis • Capital assets pricing model • Simple interest, Compound interest & annuities
65+ Reviews
86+ Question Solved
Related Book For 

Physics For Scientists And Engineers A Strategic Approach With Modern Physics
ISBN: 9780321740908
3rd Edition
Authors: Randall D. Knight
Question Posted:
