

The graph of f(x) = sinh x is shown in Figure 6.92. Use calculus to find the
Question:
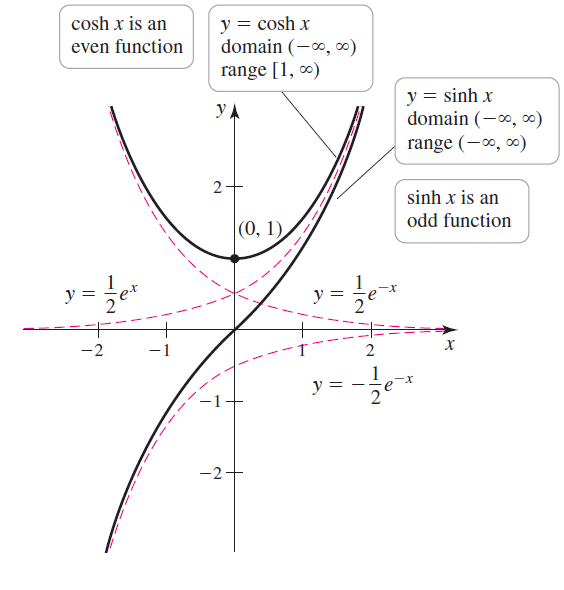
The graph of f(x) = sinh x is shown in Figure 6.92. Use calculus to find the intervals of increase and decrease for f, and find the intervals on which f is concave up and concave down to confirm that the graph is correct.
Fantastic news! We've Found the answer you've been seeking!
Step by Step Answer:
fx cosh x 0 for all so f is increasing on x sinh ...View the full answer

Answered By
Nazrin Ziad
I am a post graduate in Zoology with specialization in Entomology.I also have a Bachelor degree in Education.I posess more than 10 years of teaching as well as tutoring experience.I have done a project on histopathological analysis on alcohol treated liver of Albino Mice.
I can deal with every field under Biology from basic to advanced level.I can also guide you for your project works related to biological subjects other than tutoring.You can also seek my help for cracking competitive exams with biology as one of the subjects.
2+ Reviews
10+ Question Solved
Related Book For 

Calculus Early Transcendentals
ISBN: 978-0321947345
2nd edition
Authors: William L. Briggs, Lyle Cochran, Bernard Gillett
Question Posted:
