

Question: For the following table of data, (a) Draw a scatterplot. (b) Calculate the correlation coefficient. (c) Calculate the least squares line and graph it on
For the following table of data,
(a) Draw a scatterplot.
(b) Calculate the correlation coefficient.
(c) Calculate the least squares line and graph it on the scatterplot.
(d) Predict the y-value when x is 11.
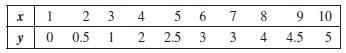
X y 2 3 1 0 0.5 4 12 5 6 2.5 3 7 3 8 9 10 4 4.5 5
Step by Step Solution
★★★★★
3.22 Rating (163 Votes )
There are 3 Steps involved in it
1 Expert Approved Answer
Step: 1 Unlock

a b c The least squ... View full answer
Question Has Been Solved by an Expert!
Get step-by-step solutions from verified subject matter experts
Step: 2 Unlock
Step: 3 Unlock