

The following table lists the reported number of cases of infants born in the United States with
Question:
The following table lists the reported number of cases of infants born in the United States with HIV in recent years because their mother was infected.
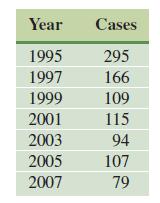
a. Plot the data on a graphing calculator, letting t = 0 correspond to the year 1995.
b. Using the regression feature on your calculator, find a quadratic, a cubic, and an exponential function that models this data.
c. Plot the three functions with the data on the same coordinate axes. Which function or functions best capture the behavior of the data over the years plotted?
d. Find the number of cases predicted by all three functions for 2015. Which of these are realistic? Explain
Step by Step Answer:

This question has not been answered yet.
You can Ask your question!


Calculus With Applications
ISBN: 9780321831101
10th Edition
Authors: Margaret L Lial, Raymond N Greenwell, Nathan P Ritchey
