

The graph at the top of the next column shows the typical weight (in kilograms) of an
Question:
The graph at the top of the next column shows the typical weight (in kilograms) of an English boy for his first 18 years of life.
(a) Sketch the graph of the rate of change of weight with respect to time.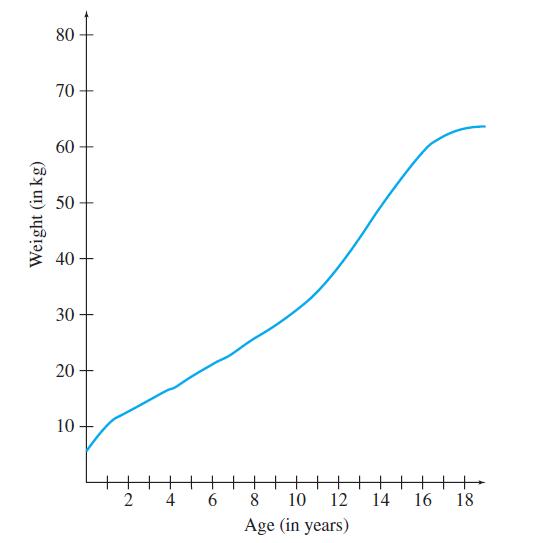
(b) Based on your graph from part (a), when does the average English boy grow the slowest? Does your answer make sense?
Fantastic news! We've Found the answer you've been seeking!
Step by Step Answer:
ab kgy...View the full answer

Answered By
Wahome Michael
I am a CPA finalist and a graduate in Bachelor of commerce. I am a full time writer with 4 years experience in academic writing (essays, Thesis, dissertation and research). I am also a full time writer which assures you of my quality, deep knowledge of your task requirement and timeliness. Assign me your task and you shall have the best.
Thanks in advance
63+ Reviews
132+ Question Solved
Related Book For 

Question Posted:
