

The graph at the top of the next column shows how the body mass index-for-age percentile for
Question:
The graph at the top of the next column shows how the body mass index-for-age percentile for boys varies from the age of 2 to 20 years.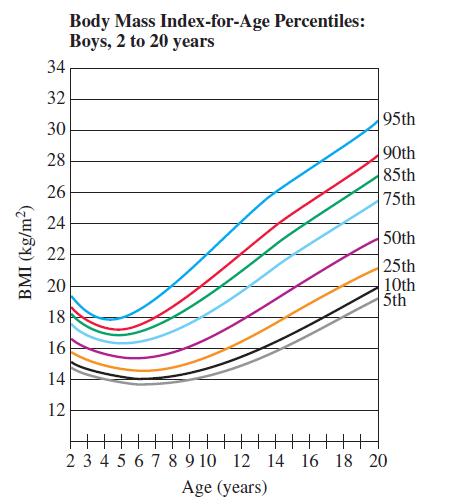
(a) Sketch a graph of the rate of change of the 95th percentile as a function of age.
(b) Sketch a graph of the rate of change of the 50th percentile as a function of age.
Fantastic news! We've Found the answer you've been seeking!
Step by Step Answer:
a The curve slants downward up to about age 425 where it turns and ...View the full answer

Answered By
Meenal Gupta
Yes I am an offline tutor, now a days teaching students of different subjects like maths, history , english and accounts.
0 Reviews
10+ Question Solved
Related Book For 

Question Posted:
